CAPITAL INVESTMENT
CAPITAL ACCOUNT
Net borrowing from overseas decreases to its lowest level since June quarter 1997
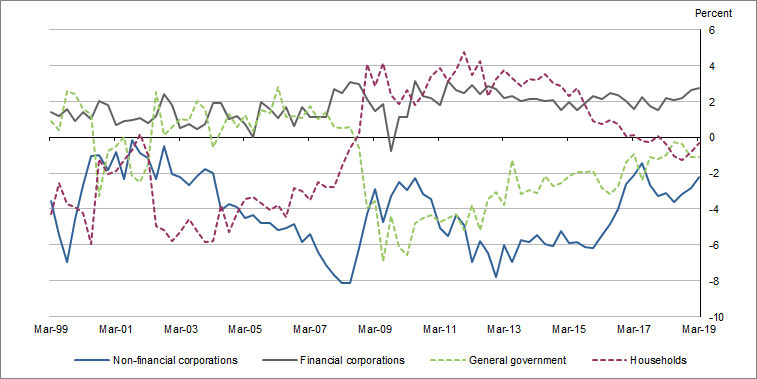
In seasonally adjusted terms, Australia has been a net borrower from overseas since September quarter 1975. In the national accounts, this is reflected by a negative value for net lending to non-residents.
The ratio of net borrowing from overseas to GDP fell to 0.6% this quarter and now sits at its lowest level since March quarter 1975. This is predominantly driven by sustained growth in gross saving outstripping rises in GDP. Weakness in investment since 2012, due to mining and more recently dwellings, has contributed to the declines in the ratio.
Graph 1. Net lending (net borrowing), by sector, relative to GDP, seasonally adjusted

National capital investment falls, driven by the household sector
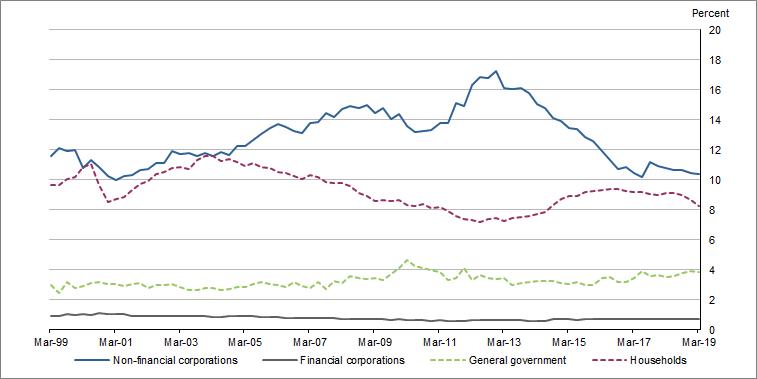
Household investment as a proportion of GDP has now declined for three consecutive quarters. This decline continues to be driven by weakness in dwelling investment and ownership transfer costs, in line with soft housing market conditions.
Capital investment by non-financial corporations showed a slight decline this quarter, from 10.4% to 10.3% as a proportion of GDP. While mining investment continued to detract, there was strength in new building this quarter with a number of significant accommodation and office projects currently under construction. The latter is supported by employment growth and declining office vacancy rates in a number of Australian cities.
General government investment as a proportion of GDP remained flat at 3.9% this quarter. The ratio has trended up since mid-2015, reflecting increased public infrastructure investment by state and local general governments to support population growth and growing demand for public services.
Graph 2. Gross fixed capital formation, by sector, relative to GDP, seasonally adjusted

 Print Page
 Print All
 Quality Declaration