ANALYSIS AND COMMENTS
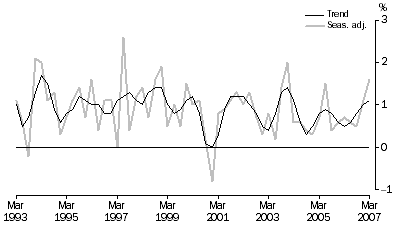
GROWTH RATES IN GDP
In seasonally adjusted terms, GDP increased by 1.6% in the March quarter, the highest growth since December quarter 2003 (2.0%). Through the year growth in trend terms was 3.5% (3.8% seasonally adjusted), the highest since September 2004. In trend terms, Non-farm GDP increased by 4.4% (4.6% seasonally adjusted) through the year, the highest growth since December 2002.
Percentage changes, Volume measures
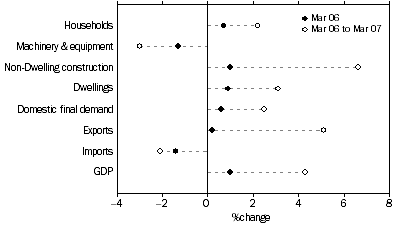
On the expenditure side, the growth (in trend volume terms) over the past four quarters was driven by Household final consumption expenditure (contributing 2.4 percentage points to GDP growth), and Exports of goods and services (contributing 0.8 percentage points). Offsetting the growth during the past four quarters was a strong rise in Imports of goods and services (detracting 2.4 percentage points).
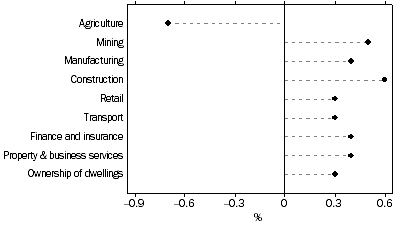
On the production side, the strongest industries (in trend volume terms) over the past four quarters have been Construction (0.6 percentage points), Mining (0.5 percentage points) and Manufacturing, Finance and insurance and Property and business services all contributing 0.4 percentage points to GDP growth. Detracting from growth was Agriculture, which took 0.7 percentage points from GDP growth over the past four quarters.
Selected Industries Contribution to growth, Mar 06 to Mar 07 - Trend
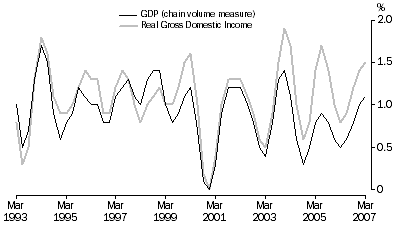
REAL GROSS DOMESTIC INCOME
The real purchasing power of income generated by domestic production can be affected by changes in import and export prices. Real gross domestic income adjusts the chain volume measure of GDP by the Terms of trade. The graph below provides a comparison of quarterly movements in trend GDP (volume measure) and Real gross domestic income. During the March quarter, trend Real gross domestic income increased by 1.5%, compared to the increase in the trend volume measure of GDP of 1.1%, reflecting a 1.6% improvement in the trend Terms of trade. Growth in Real gross domestic income over the past 4 quarters is 5.1% compared to 3.5% for GDP.
Percentage changes: Trend
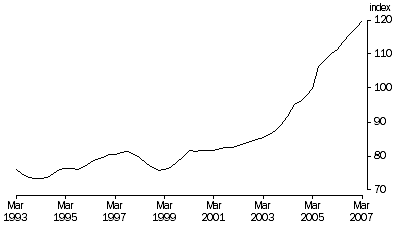
TERMS OF TRADE
The Terms of trade represent the relationship between the prices of exports and imports. An increase (decrease) in the Terms of trade reflects export prices increasing (decreasing) at a faster rate than import prices. The strong growth in the Terms of trade from December quarter 2003 (up 33.9%) reflects growth of over 35% in export prices and relatively flat import price growth over the period. The March quarter 2007 saw a 1.6% increase in trend terms to a record high in the Terms of trade index since September quarter 1959.
Trend, (2004-05 = 100)
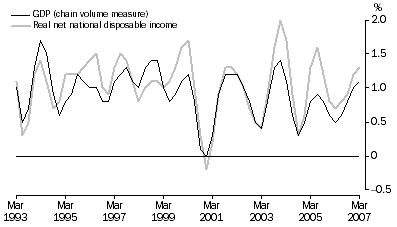
REAL NET NATIONAL DISPOSABLE INCOME
A broader measure of change in national economic well-being is Real net national disposable income. This measure adjusts the volume measure of GDP for the Terms of trade effect, Real net incomes from overseas and Consumption of fixed capital (see Glossary for definitions). The graph below provides a comparison of quarterly movements in trend GDP (volume measure) and Real net national disposable income. During the March quarter, trend Real net national disposable income increased by 1.3%, with growth over the past 4 quarters at 4.3% compared to 3.5% for GDP.
Percentage changes: Trend
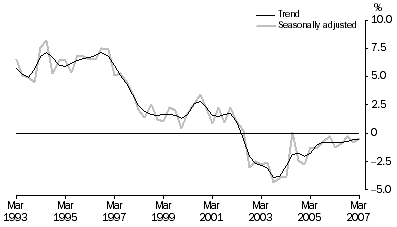
NET EXPORTS CONTRIBUTION TO GROWTH
Net exports represents the difference between exports and imports of goods and services. Net exports detract from GDP growth when the change in the volume of imports is greater than the change in the volume of exports. In the March quarter, Net exports, in trend terms, detracted 0.6 percentage points from GDP growth. In seasonally adjusted terms, Net exports detracted 0.2 percentage points in the March quarter compared to the 1.3 percentage points detraction in the previous quarter.
Net Exports Contribution to growth, Volume measures
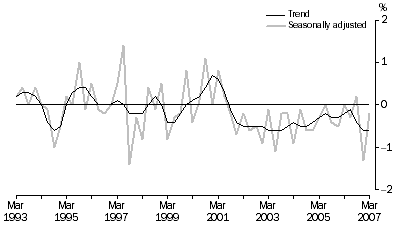
HOUSEHOLD SAVING RATIO
In both trend (-0.5%) and seasonally adjusted (-0.4%) terms the Household saving ratio was negative in March quarter 2007, implying that Household consumption was greater than Household disposable income.
Household saving cannot be directly measured by the National Accounts. Rather it is calculated as a residual item by deducting Household final consumption expenditure from Household gross disposable income. As the difference between the two aggregates is relatively small, caution should be exercised in interpreting the Household saving ratio in recent years, because major components of household income and expenditure may be subject to significant revisions. The impact of these revisions on the saving ratio can cause changes in the direction of the trend.
Household saving ratio, Current prices
For more information on the Household saving ratio please refer to Spotlight on National Accounts - Household Saving Ratio (cat. no. 5202.0).
PRICES IN THE NATIONAL ACCOUNTS
The National Accounts provides information on price movements within the various expenditure components of GDP. Through the year to March quarter 2007 growth in the Household final consumption expenditure (HFCE) chain price index in original terms was 2.2%, compared to 2.4% growth over the same period in the Consumer Price Index (CPI). The HFCE chain price index is the National Accounts measure most directly comparable to the CPI, however, it should be noted that the conceptual bases for these two price measures are different. The most important differences are the frequency with which each index is reweighted, the range of lower level indexes contributing to each index and the concepts and treatment of household expenditure, particularly in respect of home ownership costs.
The chain price index for Machinery & equipment fell 1.3% during the quarter and is now 3.0% lower than the March quarter 2006. The Non-dwelling construction chain price index increased 1.0% during the March quarter and is now 6.6% higher than the March quarter 2006. The Domestic final demand chain price index, encompassing changes in both consumption and investment prices, increased by 0.6% in the quarter and 2.5% through the year.
Export prices rose 0.2% during the quarter and 5.1% through the year. Import prices fell 1.4% during quarter and 2.1% through the year. The net effect of Export and Imports prices contributed 0.3 percentage points to the 1.0% increase in the GDP chain price index during the quarter.
Selected Expenditure chain price indexes, Percentage changes: Original
NATIONAL ACCOUNTS LABOUR MARKET INDICATORS
The National Accounts dataset contains a number of labour market related indicators.
Labour costs are the costs incurred by employers in the employment of labour. These costs include wages and salaries, paid leave, superannuation, taxes on employment, training and recruitment costs, and fringe benefits (included in wages and salaries in the national accounts). They are of particular interest as they impact on the competitiveness of organisations, employers' willingness to employ and individuals' willingness to supply labour.
Labour costs are reflected in household income via Compensation of employees and as such have a significant impact on household consumption, investment and saving decisions.
In March quarter 2007, seasonally adjusted Compensation of employees grew by 2.0%, while the seasonally adjusted number of employees recorded in the Labour Force Survey grew by 0.9%. Average compensation per employee increased by 1.1%.
Through the year growth in seasonally adjusted average compensation per employee was 4.4% compared to 4.1% growth over the same period in the total hourly rates of pay, excluding bonuses as published in Labour Price Index, Australia (cat. no. 6345.0). It should be noted that the conceptual bases for these two wage measures are different.
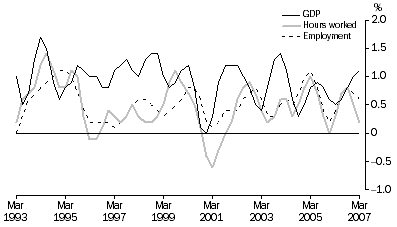
In trend terms, Hours worked increased by 0.2% during the March quarter with through the year growth at 2.2%. In the Market sector (see Glossary for definition) Hours worked increased by 0.4% during the March quarter with through the year growth at 2.8%.
In the March quarter 2007, GDP per hour worked (in trend terms) rose 0.9%, compared with 0.6% in the December quarter 2006. Market sector GDP per hour worked (in trend terms) rose 0.7% in the March quarter 2007 and 1.3% through the year. Estimates of GDP per hour worked are commonly interpreted as changes in labour productivity. However, it should be noted that these measures reflect not only the contribution of labour to changes in production per hour worked, but also the contribution of capital and other factors (such as managerial efficiency and economies of scale).
The graph below presents quarterly growth rates in trend GDP, employment and hours worked. Growth in both employment and hours worked has slowed over the past two quarters, in contrast to increasing growth in GDP. The relationship between GDP, employment and hours worked is complex and has attracted a great deal of interest. The ABS has produced a number of pieces of analysis which investigate the relationship in detail. For more information please refer to Leading Indicators of Employment (Feature Article) and the Research Paper: Analysing the Terms of Trade Effect on GDP and Employment in the Presence of Low Real Unit Labour Costs (cat. no. 1351.0.55.014).
Percentage changes, Trend
Unit labour costs (ULC) represent a link between productivity and the cost of labour in producing output. A Nominal ULC measures the average cost of labour per unit of output while a Real ULC adjusts the nominal ULC for general inflation. Positive growth in a real ULC indicates that labour cost pressures exist.
In the March quarter 2007, the trend Real ULC decreased by 1.7% while the trend Non-farm Real ULC decreased by 1.4%. The Non-farm measure is generally preferred as it removes the fluctuations associated with Agriculture.
CHANGES IN INVENTORIES
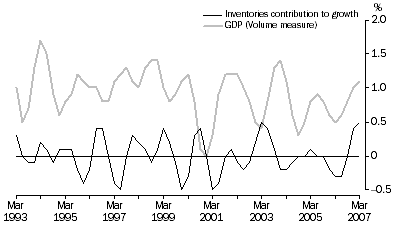
Changes in inventories can have a significant impact on the growth in GDP in any particular quarter. A positive change in inventories can be seen as production increasing at a faster rate than consumption but the exact reasons underlying changes in inventories can be far more complex. For example, firms may run up or run down inventories in anticipation of future sales, supply constraints could affect inventories, or firms may under or over estimate sales in a particular period.
The graph below shows GDP growth and the Change in inventories contribution to GDP growth, both in trend terms. Even in trend terms the Change in inventories contribution to GDP growth is quite volatile. The last two quarters have seen the strongest contributions, in trend terms, since 2003.
Inventories and GDP: Trend
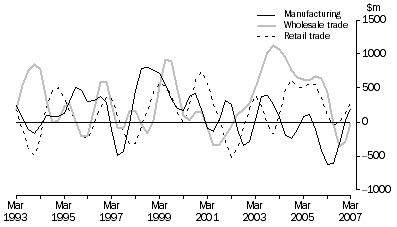
Change in inventories can be disaggregated into a number of industries. The graph below shows the three largest inventory holding industries, Manufacturing, Wholesale and Retail trade. For the past two quarters Manufacturing and Retail have shown a buildup in inventories. The downward trend in Wholesale since September quarter 2005 has slowed over the past two quarters.
Change in inventories, Selected industries: Trend
UPDATE - IMPACT OF THE DROUGHT
The ABS has updated its projections for the impact of the drought on agricultural production in 2006-07 using forecasts from the March 2007 edition of the Australian Bureau of Agricultural and Resource Economics (ABARE) Australian Commodities.
In annual terms Farm GDP is projected to fall from $26.5b in 2005-06 to $20.9b in 2006-07, a fall of $5.5b or 20.9%. If this were to actually occur it will make a negative contribution of approximately 0.6% to GDP growth in 2006-07.
The table below presents updated estimates of agricultural production in seasonally adjusted volume terms. It provides published estimates up to the March 2007 quarter and a projection for the June 2007 quarter. Outputs are projected to fall at a faster rate relative to inputs in 2006-07. Outputs are projected to fall by 16.3% in 2006-07, driven by lower cereals (-61.2%) and non-cereal crops (-13.2%). Inputs are projected to fall by 10.3% in 2006-07. All inputs are projected to fall, with marketing costs showing the largest fall, declining by 28.3% in 2006-07.
Agricultural production, Volume measures(a) - Seasonally adjusted |
|  |
| 2005-06 | 2006-07 | |
| Mar | Jun | Sep | Dec | Mar | Jun(b) | |
| $m | $m | $m | $m | $m | $m | |
| |
| Outputs | 12 007 | 11 613 | 10 683 | 9 824 | 9 716 | 8 869 | |
| Inputs | 5 220 | 5 032 | 4 816 | 4 567 | 4 471 | 4 290 | |
| Gross farm product at market price | 6 786 | 6 581 | 5 867 | 5 257 | 5 246 | 4 578 | |
| Less net taxes on products | 135 | 130 | 120 | 110 | 109 | 99 | |
| Gross value added at basic prices | 6 652 | 6 451 | 5 747 | 5 147 | 5 137 | 4 479 | |
| Gross domestic product | 231 466 | 232 910 | 234 022 | 236 482 | 240 295 | na | |
| |
| na not available |
| (a) Reference year for volume measures is 2004-05. |
| (b) Projections are based on ABARE forecasts. |
The graphs below, in seasonally adjusted volume terms, show the updated projections for the five major categories of agricultural output. It shows that the most significant impact of the current drought will be to cereal and non-cereal crops.
Farm output, Volume measures(a) - Seasonally adjusted
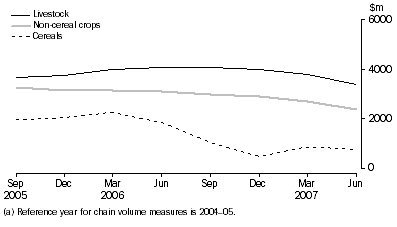 Farm output, Volume measures(a) - Seasonally adjusted
RELIABILITY OF CONTEMPORARY TREND ESTIMATES
Trend estimates are used throughout this publication as an alternative approach to the analysis of movements in time series data. Further details regarding the procedures used to estimate the trend series are described in the Explanatory Notes (paragraphs 13 - 17) and in Information Paper: A Guide to Interpreting Time Series - Monitoring Trends, 2003 (cat.no.1349.0).
Potential revisions to trend estimates can be indicated by showing the effects of particular changes in seasonally adjusted estimates that might occur in the next quarter. The table below shows the trend estimates for the last ten quarters and the values to which they would be revised if the given movements in seasonally adjusted GDP actually occurred in June quarter 2007. In the absence of any other revisions, seasonally adjusted growth of 0.6% is required in June quarter 2007 to maintain, in June quarter 2007, the trend growth of 1.1% currently estimated for the March quarter 2007.
Percentage change in GDP Chain volume measure |
| |
| | | | Trend estimate if seasonally adjusted GDP changes by the following amounts in June qtr 2007 | |
| | Seasonally adjusted GDP as published in table 2 | Trend GDP as published in table 1 | Grows by 1.0% | No change | Falls by 1.0% | |
| |
| 2004 | | | | | | |
| December | 0.3 | 0.5 | 0.5 | 0.5 | 0.5 | |
| 2005 | | | | | | |
| March | 0.7 | 0.8 | 0.8 | 0.8 | 0.8 | |
| June | 1.5 | 0.9 | 0.9 | 0.9 | 0.9 | |
| September | 0.4 | 0.8 | 0.8 | 0.8 | 0.8 | |
| December | 0.6 | 0.6 | 0.6 | 0.6 | 0.6 | |
| 2006 | | | | | | |
| March | 0.7 | 0.5 | 0.5 | 0.5 | 0.5 | |
| June | 0.6 | 0.6 | 0.6 | 0.6 | 0.6 | |
| September | 0.5 | 0.8 | 0.7 | 0.8 | 0.9 | |
| December | 1.1 | 1.0 | 1.1 | 1.0 | 0.9 | |
| 2007 | | | | | | |
| March | 1.6 | 1.1 | 1.2 | 1.0 | 0.7 | |
| |
 Print Page
 Print All