The number of businesses applying water in 2016-17 fell 3% to 22,100, down from 22,700 in 2015-16. This reflects the increased water availability in 2016-17 due to average and above average rainfall across most of Australia.
Total volume of area watered increased 4% to 2.2 million hectares in 2016-17. Increases to area watered for rice, cotton and pasture fed off are driving the national increase in 2016-17. The increase in volume applied was driven by a large increase in NSW, up 46% to 3.8 ML, primarily for rice and cotton crops.
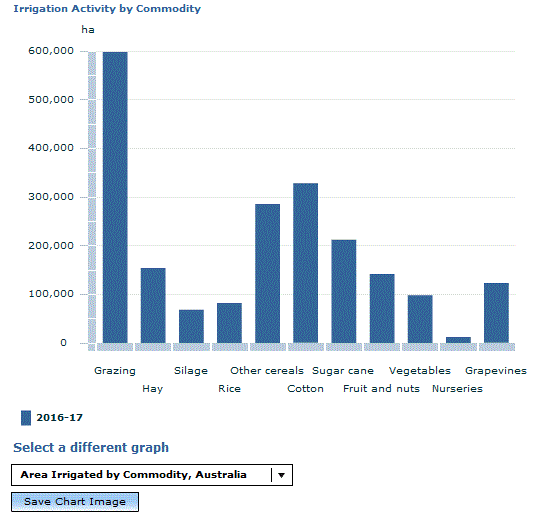
Pasture, cereal and other crops for grazing accounted for the largest area of crops irrigated during the 2016-17 period with 598,000 hectares, up 4% from the previous year however the total volume of water applied to pastures for grazing fell 8% , down to 1.5 million ML. Victoria, which irrigates the largest area of pasture, cereal and other crops for grazing had a 12% decrease in the volume of water applied (down to 793 thousand megalitres). This is attributed to the higher rainfall in 2016-17 compared to 2015-16.
Area of irrigated cotton increased 55% in 2016-17 to 328,000 ha. Increases were seen in both New South Wales and Queensland, up 50% and 65% respectively. This reflects the 59% increase in area planted for irrigated cotton in 2016-17, with a 52% increase in New South Wales and a 71% increase in Queensland. The increase in area planted in 2016-17 is due to increased water availability with higher than average rainfall seen in parts of NSW and QLD. The volume of water applied to cotton increased 79% to 2.6 million ML, with a 66% increase in New South Wales and a 108% increase in Queensland.
Document Selection
These documents will be presented in a new window.
 Quality Declaration
  Print Page
 Print All