SEPTEMBER KEY FIGURES
 |  | Sep 04 | Aug 04 to Sep 04 | Sep 03 to Sep 04 |  |
 |  | '000 | % change | % change |  |
|  |
| Short-term visitor arrivals |  |  |  |  |
 | Trend | 438.6 | 0.5 | 3.8 |  |
 | Seasonally adjusted | 433.8 | -0.3 | . . |  |
 | Original | 395.6 | . . | . . |  |
| Short-term resident departures |  |  |  |  |
 | Trend | 362.8 | 0.3 | 18.8 |  |
 | Seasonally adjusted | 368.7 | 4.2 | . . |  |
 | Original | 437.9 | . . | . . |  |
|  |
| . . not applicable |
Visitor arrivals, Short-term
| Resident departures, Short-term
|
SEPTEMBER KEY POINTS
TREND ESTIMATES
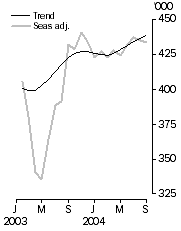
- The trend estimate for short-term visitor arrivals to Australia during September 2004 (438,600 movements) increased by 0.5% compared with August 2004. This followed monthly increases of 0.6% for July and 0.5% for August 2004.
- Currently, short-term visitor arrivals are 3.3% higher than when the series last troughed in March 2004 (424,500 movements).
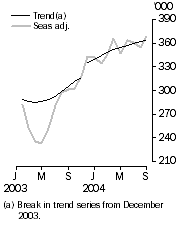
- During September 2004, short-term resident departures (362,800 movements) increased by 0.3% compared with the previous month and followed increases of 0.6% for both July and August 2004.
- Short-term resident departures have recorded steady growth over the past year, however, recent estimates indicate this growth rate is slowing. Compared with September 2003 (305,300 movements), short-term resident departures are up by 18.8%.
SEASONALLY ADJUSTED ESTIMATES
- The seasonally adjusted estimate for short-term visitor arrivals during September 2004 (433,800 movements) decreased by 0.3% compared with August 2004. This followed an increase of 1.3% for July and a decrease of 0.5% for August 2004.
- Short-term resident departures for September 2004 (368,700 movements) increased by 4.2% compared with August 2004 and followed decreases of 0.5% for July and 2.0% for August 2004.
ORIGINAL ESTIMATES
- In original terms, there were 395,600 short-term visitor arrival movements to Australia during September 2004.
- There were 437,900 short-term resident departures during September 2004.
NOTES
EARLY ESTIMATES
Early estimates of short-term visitor arrivals for October 2004 will be available on the Australian Bureau of Statistics web site on 17 November 2004. These estimates can be accessed by going to the AusStats web page and selecting Publications & Data and then Main Features. Select 34 Migration and then select Short-term Visitor Arrival Estimates, Australia (cat. no. 3401.0.55.001).
DATA NOTES
This publication contains movement data. Care should be taken when interpreting this movement data as 'people'. See paragraph 5 of the Explanatory Notes for more detail.
Calculations of percentage and numeric change are based on unrounded data. See paragraph 12 of the Explanatory Notes for more detail.
FORTHCOMING CHANGES
As of the November 2004 issue, this publication will only be available electronically. As a result of this change, overseas arrivals and departures data will be released earlier than previously advised. The revised release dates are presented above.
INQUIRIES
For further information about these and related statistics, contact the National Information and Referral Service on 1300 135 070.
MAIN FEATURES
SHORT-TERM VISITOR ARRIVALS
The following table presents the top ten source countries (based on original estimates) for short-term visitor arrivals during September 2004. Seasonally adjusted and trend estimates are also presented for these countries, along with the trend percentage change compared with August 2004 and September 2003.
Short-term Visitor Arrivals, Major Source Countries - September 2004 |
|  |
 | Trend | Seasonally Adjusted | Original | Aug 04 to Sep 04 | Sep 03 to Sep 04 |  |
 | '000 | '000 | '000 | Trend % change | Trend % change |  |
|  |
| New Zealand | 89.0 | 86.1 | 107.9 | 0.6 | 24.2 |  |
| Japan | 60.9 | 68.0 | 58.0 | 3.0 | -1.4 |  |
| United Kingdom | 56.8 | 55.8 | 40.4 | -0.7 | -1.2 |  |
| United States of America | 37.3 | 35.8 | 26.4 | -0.1 | 5.5 |  |
| China | 19.2 | (a)np | 16.4 | 0.5 | 8.2 |  |
| Singapore | 19.6 | 19.2 | 15.7 | - | -12.1 |  |
| Korea | 18.2 | 18.7 | 13.8 | 1.0 | -5.8 |  |
| Germany | 11.8 | 11.5 | 11.2 | 1.4 | -1.5 |  |
| Malaysia | 15.4 | 8.3 | 10.4 | 0.9 | -0.8 |  |
| Hong Kong | 11.1 | 11.7 | 9.8 | 0.7 | -3.7 |  |
|  |
| - nil or rounded to zero (including null cells) |
| (a) Seasonally adjusted data for short-term visitor arrivals from China is of an unpublishable standard. |
SHORT-TERM RESIDENT DEPARTURES
The following table presents the top ten destinations (based on original estimates), for short-term resident departures during September 2004. Seasonally adjusted and trend estimates are also presented for these countries, along with the trend percentage change compared with August 2004 and September 2003.
Short-term Resident Departures, Major Destinations - September 2004 |
|  |
 | Trend | Seasonally Adjusted | Original | Aug 04 to Sep 04 | Sep 03 to Sep 04 |  |
 | '000 | '000 | '000 | Trend % change | Trend % change |  |
|  |
| New Zealand | 70.0 | 70.2 | 73.6 | 1.5 | 23.9 |  |
| United Kingdom | 30.5 | 30.1 | 39.0 | -0.5 | 11.8 |  |
| United States of America | 31.6 | 31.6 | 38.3 | -0.9 | 29.0 |  |
| Indonesia | 24.2 | 23.0 | 31.7 | -4.9 | (a)np |  |
| China | 16.1 | 15.7 | 22.7 | 1.5 | 36.1 |  |
| Thailand | 14.7 | 15.6 | 20.6 | 0.3 | 0.4 |  |
| Fiji | 14.3 | 14.9 | 18.8 | 0.8 | 8.1 |  |
| Italy | 7.9 | 8.4 | 16.3 | 2.0 | 19.3 |  |
| Singapore | 13.0 | 13.2 | 14.7 | 0.5 | 4.5 |  |
| Malaysia | 11.4 | 12.4 | 14.4 | 0.7 | 11.6 |  |
|  |
| (a) not available for publication, due to break in the trend series from December 2003 |
Increases in the Last Ten Years
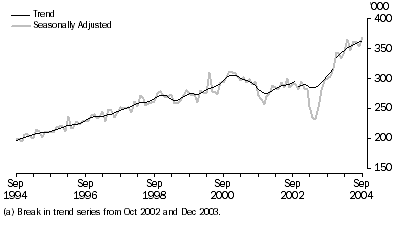
According to trend estimates, short-term resident departures have been increasing steadily for the last seventeen months and are now at their highest point for the last ten years. This follows declines for most of the months from November 2002 to April 2003, and for each month of 2001. Prior to this, short-term resident departures had been increasing for most months since September 1994. Since October 2003, each month has seen the highest number of short-term resident departures on a trend basis on record to that month.
Trend estimates increased by a monthly average of 1.5% for each month from April to November 2003, and by a monthly average of 0.9% from December 2003 to September 2004. There was a break in the trend series from October 2002 and December 2003. See paragraph 22 of the Explanatory Notes for more detail.
short-term resident departures
PERMANENT AND LONG-TERM MOVEMENTS
There were 10,180 permanent (settler) arrivals into Australia during September 2004, an increase of 13% compared with September 2003 (9,010 movements). Settlers born in the United Kingdom accounted for the largest proportion (15%) followed by China and New Zealand (12%).
Statistics on overseas arrivals and departures relate to the number of movements of travellers rather than the number of travellers. Therefore, care should be taken when using long-term arrivals data as it is known some individuals who travel multiple times in a year are counted each time they cross Australia's borders (see paragraph 5 of the Explanatory Notes). Long-term arrivals in this publication are not an appropriate source of migration statistics. For further information refer to Australian Demographic Statistics (cat. no. 3101.0).
There were 4,200 Australian residents departing permanently from Australia during September 2004, an increase of 5% compared with September 2003 (3,990 movements).
STATISTICAL SIGNIFICANCE
The above presentation of movements in estimates does not take into account whether the change in movement is statistically significant. Care should be taken when interpreting the impact of numeric and/or percentage change. Please see the Standard Errors section on page 31 for more detail.
SEASONALLY ADJUSTED AND TREND ESTIMATES
SHORT-TERM VISITOR ARRIVALS
Selected Source Countries
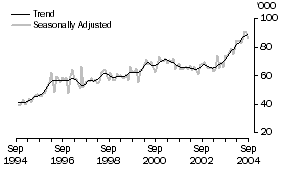
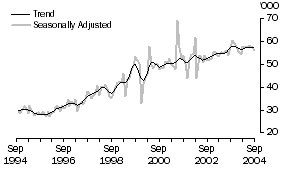
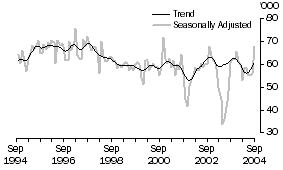
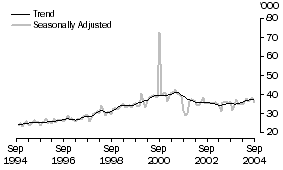
The graphs presented below illustrate the impact of the 2003 Rugby World Cup on arrivals from the United Kingdom in the later half of 2003, and the significant impact of SARS on arrivals from Japan. Arrivals from the United States of America have been increasing since November 2003, while arrivals from New Zealand have increased steadily since February 2003.
New Zealand
 United Kingdom
 Japan
Japan
 United States of America
SHORT-TERM RESIDENT DEPARTURES
Selected destinations
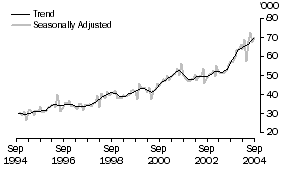
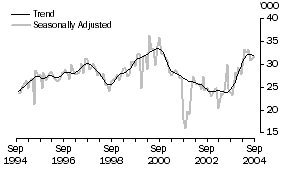
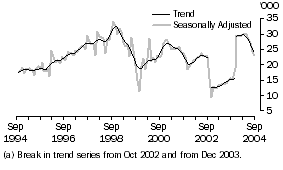
Whilst the trend in departures of Australian residents to New Zealand has continued to increase, departures to the United States of America appear to have plateaued. However, departures to Indonesia have declined gradually since April 2004.
New Zealand
 United States of America
 Indonesia
 Print Page
 Print All