MAIN FEATURES
SHORT-TERM VISITOR ARRIVALS
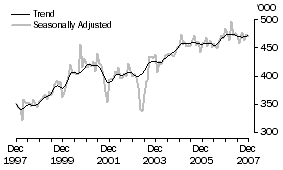
In trend terms, short-term visitor arrivals to Australia during December 2007 (470,900 movements) changed little compared with November 2007 (470,200 movements). Currently, short-term visitor arrivals are 0.2% lower than in December 2006.
The following table presents the top ten source countries (based on original estimates) for short-term visitor arrivals during December 2007. Seasonally adjusted and trend estimates are also presented for these countries, along with the percentage change in trend compared with November 2007 and December 2006.
Short-term Visitor Arrivals, Major Source Countries - December 2007 |
|  |
| Trend | Seasonally Adjusted | Original | Nov 07 to Dec 07 | Dec 06 to Dec 07 | |
| '000 | '000 | '000 | Trend % change | Trend % change | |
| |
| United Kingdom | 55.8 | 55.1 | 103.6 | -0.2 | -9.4 | |
| New Zealand | 94.7 | 94.2 | 97.8 | 0.7 | 2.2 | |
| Japan | 46.1 | 47.1 | 50.2 | -1.4 | -11.3 | |
| United States of America | 39.3 | 38.4 | 44.9 | 0.1 | 3.6 | |
| Singapore | 21.9 | 21.9 | 35.1 | 0.5 | -1.3 | |
| China | 31.0 | 30.3 | 30.5 | 0.2 | 12.2 | |
| Korea | 19.0 | 18.5 | 20.9 | -2.5 | -18.1 | |
| Malaysia | 13.7 | 13.9 | 20.2 | 2.0 | 2.2 | |
| Germany | 12.6 | 13.4 | 17.2 | 0.5 | 1.4 | |
| Hong Kong | 12.1 | 11.7 | 15.2 | -0.6 | -5.2 | |
| |
SHORT-TERM RESIDENT DEPARTURES
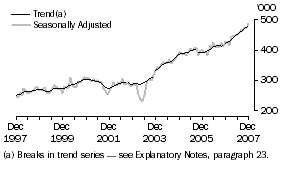
In trend terms, short-term resident departures (478,000 movements) increased by 0.8% compared with November 2007 (474,300 movements). Short-term resident departures are currently 12.9% higher than in December 2006.
The following table presents the top ten destinations (based on original estimates) for short-term resident departures during December 2007. Seasonally adjusted and trend estimates are also presented for these countries, along with the percentage change in trend compared with November 2007 and December 2006.
Short-term Resident Departures, Major Destinations - December 2007 |
| |
| Trend | Seasonally Adjusted | Original | Nov 07 to Dec 07 | Dec 06 to Dec 07 | |
| '000 | '000 | '000 | Trend % change | Trend % change | |
| |
| New Zealand | 76.7 | 76.5 | 116.2 | -0.2 | 4.0 | |
| United States of America | 42.7 | 42.9 | 56.5 | 1.1 | 15.9 | |
| United Kingdom | 37.3 | 38.3 | 43.4 | 0.6 | 11.9 | |
| Thailand | 30.9 | 31.6 | 36.3 | -0.4 | 13.5 | |
| Indonesia | 27.7 | 31.4 | 32.3 | 5.9 | 21.7 | |
| China | 24.5 | 24.1 | 27.3 | 1.1 | 14.3 | |
| Hong Kong | 18.5 | 18.2 | 24.7 | 1.7 | 13.3 | |
| Singapore | 19.6 | 19.8 | 23.2 | 0.4 | 15.9 | |
| Fiji | 18.7 | 19.0 | 23.0 | 1.8 | 22.8 | |
| Viet Nam | 13.1 | 11.8 | 22.2 | -1.0 | 13.6 | |
| |
PERMANENT AND LONG-TERM MOVEMENTS
There were 12,040 permanent (settler) arrivals to Australia during December 2007, an increase of 9.3% compared with December 2006 (11,010 movements). People born in New Zealand accounted for the largest proportion of settlers (21%), followed by people born in the United Kingdom (15%), India (9%) and China (8%).
There were 6,940 Australian residents departing permanently from Australia during December 2007, an increase of 5.7% compared with December 2006 (6,560 movements).
Statistics on overseas arrivals and departures relate to the number of movements of travellers rather than the number of travellers. Care should be taken when using long-term movements data as it is known that some individuals who travel multiple times in a year are counted each time they cross Australia's borders (see paragraph 5 of the Explanatory Notes). Long-term movements in this publication are not an appropriate source of migration statistics. For further information refer to Australian Demographic Statistics (cat. no. 3101.0) and Information Paper: Statistical Implications of Improved Methods for Estimating Net Overseas Migration, Australia, 2007 (cat. no. 3107.0.55.005).
INTERNATIONAL MOVEMENTS - 2007
In the year ended December 2007 there were a record 23.0 million crossings of Australia's international borders by travellers (original series). This represents 1,096 crossings per 1,000 Australian population. The majority of movements were short-term (96%). Short-term movements have a duration of stay in Australia or absence from Australia of less than one year. Ten years ago (1997) there were 14.9 million crossings by travellers, representing 803 crossings per 1,000 Australian population.
Just over half of the total movements in 2007 were arrivals to Australia (11.6 million). They were comprised of 5.4 million Australian residents returning after a short-term absence from Australia, 5.6 million visitors arriving for a short-term stay and 535,700 permanent and long term arrivals.
Just under half of the total movements in 2007 were departures from Australia (11.5 million). They were comprised of 5.5 million Australian residents departing short-term, 5.7 million visitors departing Australia after a short-term stay and 290,900 permanent and long-term departures.
A traveller may cross Australia's borders many times in a year and each movement is counted in these statistics. See the 3rd paragraph of the PERMANENT AND LONG-TERM MOVEMENTS section above.
Short-term visitor arrivals
Trend estimates provide the best method to analyse the underlying direction of the short-term visitor arrivals series. Over the ten year period to December 2007 trend estimates, while showing monthly fluctuations, have recorded strong long-term growth. The high point in the series was in February 2007 (474,200 movements) and the low point was in March 1998 (341,300 movements).
Irregular impacts on the short-term visitor arrivals series are demonstrated by the seasonally adjusted series. The terrorist attacks in the United States of America on 11 September 2001 and Severe Acute Respiratory Syndrome (SARS) in mid-2003 both coincide with decreases in the numbers of visitors arriving in Australia. The increase in movements in September 2000 reflects the large number of arrivals at the time of the Sydney Olympic Games.
SHORT-TERM VISITOR ARRIVALS
In original terms, a record 5.6 million short-term visitors arrived in Australia in the year ended December 2007. This compared with 5.5 million in the year ended December 2006. Ten years ago (1997), 4.3 million short-term visitors arrived in Australia.
The following table shows, for selected years, the top ten source countries (based on 2007) for short-term visitor arrivals.
When 2007 and 1997 were compared, short-term visitor arrivals from New Zealand replaced Japan as the largest source country and the United Kingdom was second. By 2007 China had moved into the top ten source countries to be placed in fifth position.
SHORT-TERM VISITOR ARRIVALS, Major Source Countries: Original Series - Calendar Years |
| |
| | 1997 | 2002 | 2007 | |
| |
| Countries as a proportion of total (%) | | | | |
| New Zealand | 15.9 | 16.3 | 20.2 | |
| United Kingdom | 9.5 | 13.3 | 12.2 | |
| Japan | 18.8 | 14.8 | 10.2 | |
| United States of America | 7.6 | 9.0 | 8.1 | |
| China | 1.5 | 3.9 | 6.3 | |
| Singapore | 5.5 | 5.9 | 4.7 | |
| Korea | 5.4 | 3.9 | 4.5 | |
| Malaysia | 3.3 | 3.3 | 2.8 | |
| Germany | 3.0 | 2.8 | 2.7 | |
| Hong Kong | 3.5 | 3.1 | 2.6 | |
| Total ('000) | 4 317.9 | 4 841.2 | 5 644.1 | |
| |
In the year ended December 2007, short-term visitor arrivals to Australia stated the main reason for journey as holiday (50%), followed by visiting friends and relatives (21%) and business (12%). In comparison the main reasons for journey in the year ended December 1997 were holiday (59%), visiting friends and relatives (19%) and business (10%). During the 2007 period the median age of short-term visitor arrivals was 39 years (1997 - 37 years) and the median duration of stay was 10 days (1997 - 9 days).
New South Wales was the intended state of stay for 39% of all short-term visitors to Australia in the year ended December 2007. The other destinations were Queensland (28%), Victoria (18%), Western Australia (10%), South Australia (3%) and Tasmania, the Northern Territory and the Australian Capital Territory (1% each).
Short-term resident departures
Trend estimates provide the best method to analyse the underlying direction of the short-term resident departures series. In the main, trend estimates have recorded strong long-term growth over the ten years ending December 2007. However, for the period commencing late 2000 and ending late 2003 movements remained relatively stable. Factors that may have contributed to short-term resident departures remaining stable during this period include the low Australian dollar in 2000, the terrorist attacks in the United States of America in September 2001, the bombing in Bali in October 2002, the anticipation and commencement of military action in Iraq in early to mid-2003 and the emergence of SARS in early 2003. The high point during the ten year period was the current month (December 2007 - 478,000 movements) and the low point was in December 1997 (249,800 movements).
The seasonally adjusted series allows for the analysis of irregular impacts on the series. The dips evident in the short-term resident departures seasonally adjusted series coincide with September 11 in 2001 and SARs in mid-2003.
SHORT-TERM RESIDENT DEPARTURES
In original terms, a record 5.5 million residents travelled overseas for short-term visits in the year ended December 2007. This compared with 4.9 million in the year ended December 2006. Ten years ago (1997), there were 2.9 million residents departing Australia short-term.
The following table shows, for selected years, the top ten destination countries (based on 2007) for short-term resident departures.
When 2007 short-term resident departures were compared with those for 1997, New Zealand, the United States of America and the United Kingdom continued to be the main destinations. There was growth in the number of short-term resident departures to Thailand and China, while numbers declined for Indonesia and Hong Kong between 1997 and 2007.
SHORT-TERM RESIDENT DEPARTURES, Major Destinations: Original Series - Calendar Years |
| |
| | 1997 | 2002 | 2007 | |
| |
| Countries as a proportion of total (%) | | | | |
| New Zealand | 13.9 | 17.3 | 16.5 | |
| United States of America | 12.0 | 8.6 | 8.8 | |
| United Kingdom | 11.0 | 9.2 | 7.8 | |
| Thailand | 3.0 | 4.9 | 6.9 | |
| China | 2.5 | 4.0 | 5.2 | |
| Indonesia | 10.6 | 7.0 | 5.2 | |
| Singapore | 3.6 | 4.3 | 4.1 | |
| Hong Kong | 5.3 | 4.1 | 3.8 | |
| Fiji | 2.6 | 3.7 | 3.7 | |
| Malaysia | 3.4 | 3.2 | 3.3 | |
| Total ('000) | 2 932.8 | 3 461.0 | 5 462.3 | |
| |
In the year ended December 2007, short-term resident departures from Australia stated holiday (50%) as the main reason for journey, followed by visiting friends and relatives (24%) and business (14%). In comparison the main reasons for journey in the year ended December 1997 were holiday (47%), visiting friends and relatives (24%) and business (18%). During the 2007 period the median age of short-term resident departures was 42 years (1997 - 40 years) and the median duration of stay was 15 days (1997 - 17 days).
The most populous states were the largest contributors to short-term travel overseas in the year ended December 2007. Residents of New South Wales contributed the highest proportion of travellers (37%), followed by Victoria (24%), Queensland (17), Western Australia (13%), South Australia (4%), the Australian Capital Territory (2%), Tasmania and the Northern Territory (1% each).
In terms of the rate of movement for short-term resident departures (the number of movements per 1,000 state or territory population) there was considerable variation across the states and territories. Western Australia had the highest movement rate (333 movements per 1,000 population) followed by the Australian Capital Territory (316), New South Wales (294), Victoria (254), Queensland (228), the Northern Territory (218), South Australia (155) and Tasmania (119). Overall, the Australian movement rate was 260 movements per 1,000 population.
STATISTICAL SIGNIFICANCE
The above presentation of movements in estimates does not take into account whether the change in movement is statistically significant. Care should be taken when interpreting the impact of numeric and/or percentage change. Please see the Standard Errors section of this issue for more detail.
 Print Page
 Print All