NEW SOUTH WALES
In 2017-18:
- The number of people living in Greater Sydney increased by 93,400 (1.8%), while the number living outside the capital city increased by 26,900 people (1.0%).
- Greater Sydney's growth rate fell from 2.2% in 2016-17.
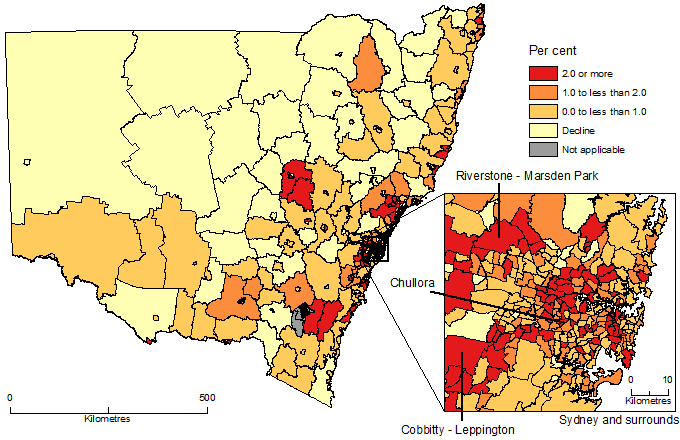
Largest growth areas: The Statistical Area Level 2 (SA2) of Riverstone - Marsden Park, in Sydney's north-west (up by 5,000 people), followed by Cobbitty - Leppington (4,500) in the city's outer south-west.
Fastest growth areas: Riverstone - Marsden Park (23%), followed by Cobbitty - Leppington (20%), and Chullora (16%) in Sydney's inner south-west.
Regional growth areas: Outside of Greater Sydney, the SA2 of Queanbeyan Region had the largest population increase (970 people), while Thornton - Millers Forest in the Hunter Valley grew the fastest (7.7%).
SA2s WITH LARGEST AND FASTEST POPULATION GROWTH, New South Wales |
|
 |  | ERP AT 30 JUNE | POPULATION CHANGE |
 |  | 2018 | 2017-2018 |
| SA2 | SA4 | no. | no. | % |
LARGEST GROWTH |
|
| Riverstone - Marsden Park | Sydney - Blacktown | 26 630 | 5 008 | 23.2 |
| Cobbitty - Leppington | Sydney - South West | 26 918 | 4 463 | 19.9 |
| Rouse Hill - Beaumont Hills | Sydney - Baulkham Hills and Hawkesbury | 27 828 | 2 672 | 10.6 |
| Waterloo - Beaconsfield | Sydney - City and Inner South | 40 251 | 2 286 | 6.0 |
| Homebush Bay - Silverwater | Sydney - Parramatta | 23 028 | 1 827 | 8.6 |
| Castlereagh - Cranebrook | Sydney - Outer West and Blue Mountains | 27 189 | 1 568 | 6.1 |
| Epping - North Epping | Sydney - Ryde | 30 487 | 1 397 | 4.8 |
| Mount Annan - Currans Hill | Sydney - Outer South West | 31 895 | 1 395 | 4.6 |
| Prestons - Edmondson Park | Sydney - South West | 20 551 | 1 329 | 6.9 |
| Arncliffe - Bardwell Valley | Sydney - Inner South West | 26 191 | 1 309 | 5.3 |
FASTEST GROWTH |
|
| Riverstone - Marsden Park | Sydney - Blacktown | 26 630 | 5 008 | 23.2 |
| Cobbitty - Leppington | Sydney - South West | 26 918 | 4 463 | 19.9 |
| Chullora | Sydney - Inner South West | 1 454 | 200 | 15.9 |
| Rouse Hill - Beaumont Hills | Sydney - Baulkham Hills and Hawkesbury | 27 828 | 2 672 | 10.6 |
| Homebush Bay - Silverwater | Sydney - Parramatta | 23 028 | 1 827 | 8.6 |
| Thornton - Millers Forest | Hunter Valley exc Newcastle | 11 616 | 833 | 7.7 |
| Prestons - Edmondson Park | Sydney - South West | 20 551 | 1 329 | 6.9 |
| Mulgoa - Luddenham - Orchard Hills | Sydney - Outer West and Blue Mountains | 11 031 | 699 | 6.8 |
| Botany | Sydney - City and Inner South | 12 439 | 732 | 6.3 |
| Castlereagh - Cranebrook | Sydney - Outer West and Blue Mountains | 27 189 | 1 568 | 6.1 |
|
POPULATION CHANGE BY SA2, New South Wales - 2017-18

 Quality Declaration
  Print Page
 Print All