MAIN FEATURES
AUSTRALIA
Estimated resident population
The preliminary estimated resident population (ERP) of Australia at 30 September 2006 was 20,674,400 persons, an increase of 269,600 since 30 September 2005 and 69,000 persons since 30 June 2006.
Growth rates
The population growth rate for the year ended 30 September 2006 (1.3%) was similar to that recorded for the year ended 30 September 2005 (1.3%). Over the last 13 years the population growth rate for Australia, for years ending 30 September, has varied between 1.0% in 1993 and 1.3% in 2006.
COMPONENTS OF POPULATION CHANGE
The growth of Australia's population has two components: natural increase (the number of births minus the number of deaths) and net overseas migration (net permanent and long-term movements).
Natural increase
Natural increase for the 12 months ended 30 September 2006 was 131,800 persons, an increase of 3.0% (or 3,800 persons) on the natural increase for the year ended 30 September 2005 (128,000 persons). The preliminary estimate for births of 264,300 in the year ended 30 September 2006 was 2.0% higher than the figure for the year ended 30 September 2005 (259,100 births). Over the same period, the preliminary estimate for deaths increased by 1.0%, removing 132,400 people from the Australian population.
Net overseas migration
The year ended 30 September 2006 recorded a preliminary estimate of 463,600 permanent and long-term arrivals and 325,900 permanent and long-term departures. These resulted in a net overseas migration (NOM) estimate of 137,700 persons. This was an 8.0% increase on the NOM estimate for the year ended 30 September 2005 (127,500 persons).
The ABS applies a number of adjustments to the overseas arrivals and departures data used to produce NOM estimates. These mainly comprise adjustments designed to reflect differences between stated travel intentions and actual travel behaviour, but (in the case of revised NOM estimates) also include adjustments to transform the numbers of overseas movements into numbers of travellers. These are collectively referred to as 'migration adjustments'. For more information see the Technical Note - Measuring Net Overseas Migration (page 41).
PRELIMINARY DATA
Due to the collection and estimation methods applied to produce preliminary statistics, users should exercise caution when analysing and interpreting the most recent annual and quarterly estimates for births, deaths and net overseas migration, particularly when making time series comparisons. For analysis of fertility trends over time the Australian Bureau of Statistics (ABS) recommends users refer to Births, Australia (cat. no. 3301.0) - see paragraphs 7-9 of the Explanatory Notes for more detail.
STATES AND TERRITORIES
Estimated resident population
The estimated resident populations for the states and territories at 30 September 2006 were as follows: New South Wales 6,844,200, Victoria 5,110,500, Queensland 4,070,400, South Australia 1,558,200, Western Australia 2,061,500, Tasmania 489,600, the Northern Territory 207,700 and the Australian Capital Territory 329,500.
Growth rates
All states and territories recorded positive population growth over the 12 months ended 30 September 2006. Western Australia recorded the largest growth rate (2.0%), followed by Queensland (1.9%), the Northern Territory (1.6%), Victoria (1.4%), the Australian Capital Territory, New South Wales, and South Australia (0.9%) and Tasmania (0.6%).
COMPONENTS OF POPULATION CHANGE
At the state and territory level population growth has three components: natural increase, net overseas migration and net interstate migration.
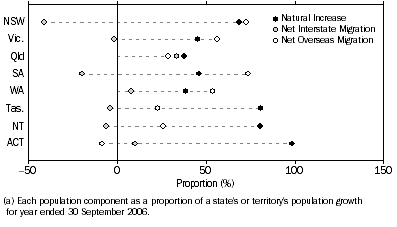
Although all states and territories experienced positive population growth in the year ended 30 September 2006, the proportion of each component varied between the states and territories.
Population Components(a), States and territories - Year ended 30 September 2006

Natural increase
As illustrated in the graph above, natural increase was the major component of population growth in the Australian Capital Territory (3,000 persons), Tasmania (2,500 persons), the Northern Territory (2,700 persons), and Queensland (28,700 persons) for the year ended 30 September 2006.
The number of births registered for the 12 months ended 30 September 2006 increased for all states and territories compare with the 12 months ended 30 September 2005. The Australian Capital Territory recorded the largest percentage increase of 8.3% while the Northern Territory recorded the smallest percentage increase of 0.4%.
Deaths registered for the year ended 30 September 2006 showed Queensland and the Northern Territory with annual decreases of 1.4% and 0.6%, respectively. All other states and territories recorded an increase in death registrations, with the Australian Capital Territory recording the largest increase of 4.3%.
Net overseas migration
NOM for the year ended 30 September 2006, as illustrated in the previous graph, was the major component of population growth in South Australia (9,900), New South Wales (43,100 persons), Victoria (39,700 persons) and Western Australia (22,200 persons). All other states and territories experienced positive NOM except the Australian Capital Territory which lost a net 260 people.
Net interstate migration
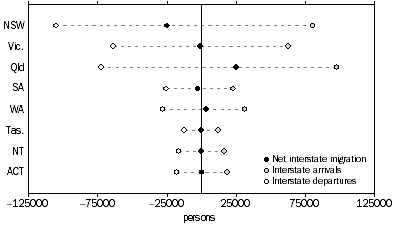
There were 341,500 persons moving interstate within Australia for the year ended 30 September 2006. Queensland experienced a smaller increase from net interstate migration compared to the previous year, whereas New South Wales, South Australia and Victoria all experienced a smaller loss from net interstate migration. The Northern Territory and Tasmania changed from positive to negative net interstate migration, whereas the Australian Capital Territory experienced the reverse. Western Australia continued to gain population from net interstate migration in the year ended 30 September 2006.
INTERSTATE MIGRATION, Arrivals, Departures and Net - States and territories - Year ended 30 September 2006

Queensland experienced the highest positive net interstate migration with an increase of 25,300 persons for the 12 months ended 30 September 2006. Other states and territories to experience positive net interstate migration were Western Australia (3,200 persons) and the Australian Capital Territory (300 persons). Negative interstate migration was experienced by New South Wales (-24,500 persons), South Australia (-2,700 persons), Victoria (-1,200 persons ), the Northern Territory (-210 persons) and Tasmania (-110).
Interstate migration within Australia, with 75,800 movements for the September quarter 2006, was the lowest since December quarter 1994 when 73,600 residents moved interstate. Over the last 12 years the trend in interstate migration has varied between the states and territories. Queensland stands alone as the only state to have consistently experienced positive net interstate migration whereas New South Wales and South Australia consistently experienced negative net interstate migration. Victoria, Western Australia, Tasmania, the Northern Territory and the Australian Capital Territory all fluctuated between positive and negative net interstate migration.
 Print Page
 Print All