MAIN FEATURES
PRELIMINARY REBASED POPULATION ESTIMATES
CHANGES FROM THE 2006 CENSUS
After each Census, the Australian Bureau of Statistics (ABS) uses the new information obtained to rebase the estimated resident population (ERP) of Australia and its States and Territories. In this issue, the ABS has used the 2006 Census of Population and Housing (2006 Census) to produce preliminary rebased estimates of the resident population.
Census counts by place of usual residence have been used to construct a new base population figure for 30 June 2006. Because this new population estimate uses the Census as its main data source, it is said to be 'based' on that Census and is referred to as a population base. Rebasing refers to the process by which the ABS uses this new base derived from the 2006 Census to update all previously published quarterly population estimates from 30 September 2001 to 30 June 2006 (the previous intercensal period). The difference between these two series of population figures during the preliminary rebasing is referred to as intercensal error, as shown in the graph below.
Census based population estimates(a), Australia
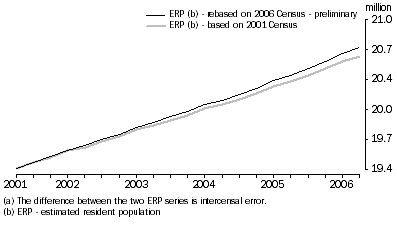
The preliminary rebased population estimates released in this issue will be updated to produce final rebased estimates in the December quarter 2007 issue of this publication (released June 2008). For further information, refer to the following feature article Preliminary Rebasing of Australia's Population Estimates Using the 2006 Census of Population and Housing.
PRELIMINARY DATA
Due to the collection and estimation methods applied to produce preliminary population statistics from the components of population change, users should exercise caution when analysing and interpreting the most recent annual and quarterly estimates.
COMPONENTS OF POPULATION CHANGE
The growth in Australia's population has two components: natural increase (the number of births minus the number of deaths) and net overseas migration (NOM) which is net permanent and long-term overseas movements with migration adjustments applied. At the state and territory level population growth has three components: natural increase, net overseas migration and net interstate migration. For information on the concepts and methods used for each of the components see the Explanatory Notes.
20 YEARS OF POPULATION CHANGE - THE PAST 4 INTERCENSAL PERIODS
POPULATION AND GROWTH (1986 TO 2006)
Over the last 20 years (June 1986 to June 2006), the ERP of Australia has grown from just over 16 million to just over 20.7 million, an increase of 29% (4,683,000 persons). During this period the national annual growth rate has varied between 1.7% in 1989 and 1.0% in 1993. The average annual growth rate over this 20 year period was 1.3%.
Growth and components of population change, Australia

COMPONENTS OF POPULATION CHANGE
Since Federation, natural increase has generally contributed more to Australia's annual population growth than net overseas migration. Over the past 20 financial years NOM has exceeded natural increase in five years: 1988, 1989, 2001, 2003 and 2006. Quarterly analysis shows NOM has exceeded natural increase for one third of the 20 year period.
AGE DISTRIBUTION
Australia's population has continued to age over the last 20 years (1986-2006) with the median age increasing from 31.1 years to 36.6 years. The proportion of persons aged 65 years and over increased from 10.5% of the total population in 1986 to 13.0% in 2006, while the proportion aged 85 years and over doubled during this time, from 0.8% to 1.6%. Conversely, over the last 20 years, the proportion of the population aged 0-14 years has decreased, from 23.1% in 1986 to 19.6% in 2006.
During this 20 year period, the populations of every state and territory have been ageing, with the median age increasing for each. Tasmania, with the oldest population in 2006, recorded the largest increase in its median age, increasing from 30.5 years in 1986 to 38.8 years in 2006. The Northern Territory, with the youngest population, recorded an increase in its median age from 25.7 years in 1986 to 30.9 years in 2006.
All states and territories experienced an increase in the proportion of their populations aged 65 years and over during this same period, with the largest increase recorded in the Australian Capital Territory (5.1% to 9.5%). For the 85 years and over age group, the largest increase was experienced by South Australia, from 0.9% in 1986 to 2.0% in 2006. Since 1986, South Australia has remained the state with the largest proportion of its population aged 65 years and over, increasing from 11.7% in 1986 to 15.1% in 2006. Of all the states and territories throughout this same period, the Northern Territory continued to have the largest proportion aged 0-14 years, decreasing from 29.2% in 1986 to 24.5 % in 2006, following the national downward trend.
Age distributions and median ages of the population - At 30 June |
|  |
| 0-14 years | 15-64 years | 65 years and over | 85 years and over | Median age | |
|
|
|
|
|
| |
| 1986 | 1996 | 2006 | 1986 | 1996 | 2006 | 1986 | 1996 | 2006 | 1986 | 1996 | 2006 | 1986 | 1996 | 2006 | |
| % | % | % | % | % | % | % | % | % | % | % | % | years | years | years | |
| |
| NSW | 22.8 | 21.1 | 19.6 | 66.3 | 66.3 | 67.0 | 11.0 | 12.6 | 13.5 | 0.8 | 1.1 | 1.6 | 31.7 | 34.4 | 36.8 | |
| Vic. | 22.5 | 20.8 | 19.0 | 66.8 | 66.7 | 67.7 | 10.7 | 12.5 | 13.3 | 0.9 | 1.2 | 1.6 | 31.3 | 34.3 | 36.7 | |
| Qld | 24.1 | 22.0 | 20.4 | 65.6 | 66.8 | 67.5 | 10.3 | 11.2 | 12.1 | 0.8 | 1.0 | 1.4 | 30.3 | 33.3 | 36.0 | |
| SA | 21.7 | 20.3 | 18.3 | 66.7 | 65.7 | 66.6 | 11.7 | 14.0 | 15.1 | 0.9 | 1.3 | 2.0 | 32.0 | 35.6 | 38.7 | |
| WA | 24.0 | 22.3 | 19.9 | 66.8 | 67.4 | 68.4 | 9.2 | 10.4 | 11.7 | 0.7 | 1.0 | 1.3 | 30.1 | 33.1 | 36.2 | |
| Tas. | 24.1 | 22.3 | 19.7 | 65.1 | 64.9 | 65.7 | 10.9 | 12.7 | 14.6 | 0.8 | 1.1 | 1.7 | 30.5 | 34.6 | 38.8 | |
| NT | 29.2 | 27.1 | 24.5 | 68.3 | 69.7 | 70.9 | 2.5 | 3.2 | 4.6 | 0.1 | 0.2 | 0.3 | 25.7 | 27.8 | 30.9 | |
| ACT | 25.8 | 22.0 | 18.7 | 69.1 | 70.7 | 71.8 | 5.1 | 7.3 | 9.5 | 0.3 | 0.5 | 1.0 | 28.1 | 31.3 | 34.4 | |
| Aust.(a) | 23.1 | 21.4 | 19.6 | 66.4 | 66.6 | 67.5 | 10.5 | 12.0 | 13.0 | 0.8 | 1.1 | 1.6 | 31.1 | 34.0 | 36.6 | |
| |
| (a) Includes Other Territories - see paragraph 2 of the Explanatory Notes. |
SEX RATIO
The proportion of males and females in the population has also been changing over time with the best indicator being the sex ratio (the number of males to every 100 females). The sex ratio of the Australian population has decreased from 99.8 in 1986 to 98.8 in 2006. In 1986, populations of the Northern Territory, Western Australia, Queensland, and the Australian Capital Territory all contained more males than females. By 30 June 2006 only the Northern Territory and Western Australia had more males. Tasmania recorded the lowest sex ratio in June 2006 at 97.3 males per 100 females whereas the Northern Territory had remained the highest at 108.0.
Sex ratios of the population(a) - At 30 June |
| |
| 1986 | 1991 | 1996 | 2001 | 2006 | |
| ratio | ratio | ratio | ratio | ratio | |
| |
| NSW | 99.4 | 99.1 | 98.6 | 98.6 | 98.2 | |
| Vic. | 98.6 | 98.4 | 97.6 | 97.0 | 98.0 | |
| Qld | 101.3 | 100.4 | 100.4 | 99.1 | 99.7 | |
| SA | 99.0 | 98.5 | 97.9 | 97.7 | 97.5 | |
| WA | 101.8 | 101.2 | 101.1 | 100.2 | 102.0 | |
| Tas. | 98.6 | 98.4 | 97.6 | 97.1 | 97.3 | |
| NT | 112.4 | 109.8 | 111.0 | 109.7 | 108.0 | |
| ACT | 100.2 | 100.0 | 98.5 | 97.4 | 98.0 | |
| Aust.(b) | 99.8 | 99.4 | 99.0 | 98.4 | 98.8 | |
| |
| (a) The sex ratio relates to the number of males per 100 females. |
| (b) Includes Other Territories - see paragraph 2 of the Explanatory Notes. |
The national sex ratio increased from 98.4 in 2001 to 98.8 in 2006 reversing the long-term decline. During the same five year period, an increase in the sex ratio was recorded for Victoria, Queensland, Western Australia, Tasmania, and the Australian Capital Territory. The increase in Australia's sex ratio is due to more males than females migrating to Australia and life expectancy increasing faster for males than for females.
5 YEARS OF POPULATION CHANGE - THE RECENT INTERCENSAL PERIOD
POPULATION AND GROWTH (2001 TO 2006)
The preliminary rebased ERP of Australia at 30 June 2006 was 20,701,000 persons, an increase over the most recent intercensal period (2001-06) of 1,288,000. During this five year period, the population grew by 6.6% compared with 6.0% for the previous intercensal period (1996-2001).
At 30 June 2006, the preliminary rebased ERP for the states and territories were as follows: New South Wales 6,817,000, Victoria 5,128,000, Queensland 4,092,000, South Australia 1,568,000, Western Australia 2,059,000, Tasmania 489,900, the Northern Territory 210,700 and the Australian Capital Territory 334,200.
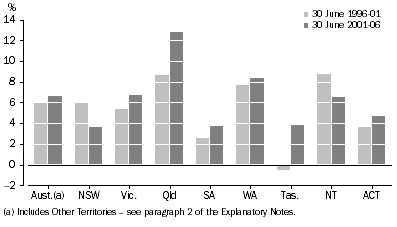
Over the last five years (2001-06), all states and territories experienced population growth. Queensland experienced the fastest growth by far, increasing 12.7%. This was followed by Western Australia (8.3%), Victoria (6.7%), the Northern Territory (6.5%), the Australian Capital Territory (4.7%), Tasmania (3.8%) and then South Australia and New South Wales both with the smallest growth (3.7%). When compared to the previous five year period (1996 to 2001), New South Wales and the Northern Territory were the only two jurisdictions that did not experience a higher growth rate. Tasmania, when compared to the previous five year period, experienced the largest change to its population growth, changing from negative to positive growth.
Total Population Growth, Intercensal periods - 1996 to 2006
The national average annual growth rate for the five year period from June 2001 to June 2006 was 1.3%. This was the same as the 20 year average (1986-06) but was higher than the previous five year period (1996-2001) at 1.2%. The annual population growth rate for the year ending 30 June 2006 was higher than these averages at 1.4%.
Over the last intercensal period (2001-06), the average annual growth rates for the states and territories from highest to lowest were as follows: Queensland 2.4%, Western Australia 1.6%, Victoria and the Northern Territory both at 1.3%, the Australian Capital Territory 0.9%, Tasmania 0.8% and the lowest growth being shared between New South Wales and South Australia both at 0.7%.
COMPONENTS OF POPULATION CHANGE
During the past five years (2001-06), natural increase contributed 606,900 persons to Australia's total population growth, 0.1% lower than the previous intercensal period (1996-2001). Net overseas migration, on the other hand, contributed 585,300 persons which was 15.8% higher than that recorded for the previous intercensal period.
Although all states and territories experienced positive population growth over the previous five year period, June 2001 to June 2006, the proportion each component contributed to, or subtracted from, population growth varied considerably between the states and territories.
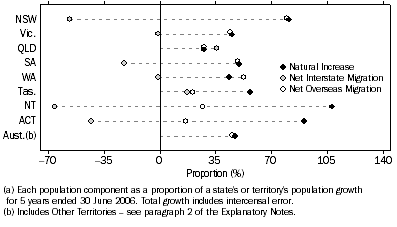
Population Components, Proportion of total growth(a) - 5 years ended 30 June 2006
Natural increase
As illustrated in the graph above, for the five year period 2001 to 2006, natural increase was the main component of population growth for the majority of the states and territories including the Northern Territory, the Australian Capital Territory, New South Wales, Tasmania, South Australia and Victoria.
Births
When comparing the number of births recorded between the last intercensal period (2001 to 2006) and the previous intercensal period (1996 to 2001), there was a 1.4% increase at the national level. However, not all states and territories experienced an increase. Those recording a decrease in births were South Australia (-3.1%), Tasmania (-1.0%), New South Wales (-0.9%) and the Australian Capital Territory (-0.4%), whereas an increase was recorded by Queensland (5.4%), Victoria (3.5%), the Northern Territory (1.7%) and Western Australia (0.7%).
Deaths
Comparing the number of deaths recorded between the last intercensal period and the previous intercensal period showed there was an increase for all states and territories with a national increase of 2.8%.
Net overseas migration
Net overseas migration made a contribution to population growth of each state and territory for the five year period 2001 to 2006. Western Australia was the only state where NOM was the major component of population growth (52%).
As illustrated in the previous graph, the contribution to population growth made by NOM over the five year period (2001-06) was very close to that of natural increase in New South Wales, South Australia, Victoria, Queensland and at the national level. For the Northern Territory, the Australian Capital Territory and Tasmania, NOM contributed a relatively small amount to population growth compared to natural increase.
Net interstate migration
Within Australia during the past five years (June 2001 to June 2006), estimates of quarterly interstate migration showed there were 1.87 million movements interstate. As illustrated in the previous graph, Queensland was the only state where net interstate migration was the major component of population growth.
During the same period, Queensland consistently recorded the highest positive net interstate migration by far, with an increase of 164,400 persons. Tasmania was the only other state to experience positive net interstate migration, adding 3,100 to its population. This increase occurred predominantly between June 2002 and June 2004. The remaining states and territories all lost population through net interstate migration over this same five year period, including New South Wales (-136,300), South Australia (-12,600), the Northern Territory (-8,500), the Australian Capital Territory (-6,400), Victoria (-2,200) and Western Australia (-1,400).
Interstate migration, Arrivals, Departures and Net - States and territories - 5 years ended 30 June 2006
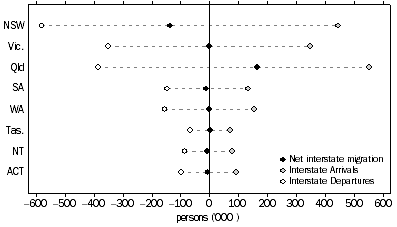
Over the five year period (2001-2006), the largest interstate migration movement was the 289,500 persons moving from New South Wales to Queensland. The second largest movement was the inverse of this, with 179,900 persons moving from Queensland to New South Wales. The next largest movement was those persons moving from New South Wales to Victoria (130,300 persons ).
The above analysis on net interstate migration is based on preliminary results and will be revised in the December Quarter 2007 issue of this publication. For more information see paragraph 21 of the Explanatory Notes.
ANNUAL POPULATION CHANGE - YEAR ENDING 31 DECEMBER 2006.
POPULATION AND GROWTH 2006
The preliminary estimated resident population (ERP) of Australia at 31 December 2006 was 20,852,000 persons, an increase of 293,100 since 31 December 2005 and 73,200 persons since 30 September 2006. The population growth rate for the year ended 31 December 2006 (1.4%) was similar to that recorded for the year ended 31 December 2005 (1.4%).
COMPONENTS OF POPULATION CHANGE
Natural increase
Natural increase for the 12 months ended 31 December 2006 was 132,100 persons, a decrease of -1.4% (or 1,900 persons) on the natural increase for the year ended 31 December 2005 (133,900 persons).
Births
The preliminary estimate for births of 265,900 in the year ended 31 December 2006 was the highest recorded for the past 35 years and was 0.3% higher than the figure for the year ended 31 December 2005 (265,000).
Deaths
Over the same period, the preliminary estimate for deaths increased by 2.1%, removing 133,900 people from the population. This was the highest annual number of deaths ever recorded for Australia.
Net overseas migration
For the year ended 31 December 2006 Australia recorded a preliminary net overseas migration (NOM) estimate of 147,700 persons. The contribution made to population growth by NOM was 11.9% higher than that of natural increase.
An improved method for calculating NOM
The ABS has introduced an improved method for estimating NOM. This method has been used for September quarter 2006 onwards. Preliminary NOM estimates are based on international movement data for the reference quarter, adjusted by information derived from travellers with the same characteristics from the corresponding quarter two years earlier. Final NOM estimates (becoming available in March 2009) are based on the actual duration of stay in Australia and overseas of international travellers.
The time series using the previous method for calculating NOM finishes at June quarter 2006. Estimates from this past time series and the current time series are not comparable. For further information see Information Paper: Improved Methods for Estimating Net Overseas Migration (cat. no. 3107.0.55.003) released on 10 February 2006; Information Paper: Statistical Implications of Improved Methods for Estimating Net Overseas Migration, Australia 2007 (cat. no. 3107.0.55.005) and the Technical Note Measuring Net Overseas Migration, Method Used September Quarter 2001 to June Quarter 2006 in this publication.
STATES AND TERRITORIES POPULATION AND GROWTH
The estimated resident populations for the states and territories at 31 December 2006 were as follows: New South Wales 6,855,000, Victoria 5,165,000, Queensland 4,132,000, South Australia 1,576,000, Western Australia 2,081,000, Tasmania 491,700, the Northern Territory 212,600 and the Australian Capital Territory 336,400.
All states and territories recorded positive population growth over the 12 months ended 31 December 2006. Western Australia recorded the fastest growth rate (2.1%), followed by Queensland (2.0%), the Northern Territory (1.8%), Victoria (1.5%), the Australian Capital Territory (1.2%), South Australia (1.0%), New South Wales (0.9%), and Tasmania (0.6%).
COMPONENTS OF POPULATION CHANGE
Although all states and territories experienced positive population growth in the year ended 31 December 2006, the proportion of each component varied between the states and territories.
Population Components, Proportion of total growth(a) - Year ended 31 December 2006

Natural increase
As illustrated in the graph above, natural increase was the major component of population growth in Tasmania (2,500 persons), the Australian Capital Territory (3,000 persons), the Northern Territory (2,700 persons), and Queensland (28,200 persons) for the year ended 31 December 2006.
Births
The number of births registered for the 12 months ended 31 December 2006 in each state and territory recorded some increases and some declines when compare with the 12 months ended 31 December 2005. The Australian Capital Territory recorded the largest percentage increase of 8.8%, while New South Wales recorded the largest percentage decrease of -1.6%.
Deaths
Deaths registered for the year ended 31 December 2006 showed the Northern Territory had an annual decrease of 5.5% and both Victoria and South Australia had an annual decrease of 0.2%. All other states and territories recorded an increase in death registrations, with Queensland recording the largest increase of 6.2%.
Net overseas migration
Net overseas migration for the year ended 31 December 2006, as illustrated in the previous graph, was the major component of population growth in New South Wales (46,800 persons), South Australia (11,200), Victoria (42,000 persons) and Western Australia (22,000). All other states and territories experienced positive NOM except the Australian Capital Territory which had a net lost of 670 people overseas.
Net interstate migration
Estimates of quarterly interstate migration showed there were 341,600 persons moving interstate within Australia for the year ended 31 December 2006. When compared to the previous year ended 31 December 2005, Western Australia and the Australian Capital Territory recorded larger gains from net interstate migration whereas Queensland experienced a smaller increase. New South Wales, South Australia and Victoria all experienced a smaller loss from net interstate migration over this same period. The Northern Territory and Tasmania changed from positive to negative net interstate migration in the year ended 31 December 2006.
Interstate migration, Arrivals, Departures and Net - States and territories - Year ended 31 December 2006

Queensland experienced the highest positive net interstate migration with an increase of 25,500 persons for the 12 months ended 31 December 2006. Other states and territories to experience positive net interstate migration were Western Australia (3,800 persons) and the Australian Capital Territory (500 persons). Negative interstate migration was experienced by New South Wales (-25,300 persons), South Australia (-2,800 persons), Victoria (-1,000 persons ), Tasmania (-390) and the Northern Territory (-360 persons).
 Print Page
 Print All