The Aboriginal and Torres Strait Islander population of Australia was estimated at 458,500 people at 30 June 2001, or 2.4% of the total Australian population. The Indigenous population is projected to have grown to between 492,700 (low-series projection) and 525,000 (high-series projection) by mid-2005 (Appendix 2).
In 2001, around 90% of Indigenous people were identified as being of Aboriginal origin, 6% were identified as being of Torres Strait Islander origin and 4% were identified as being of both Aboriginal and Torres Strait Islander origin.
Age
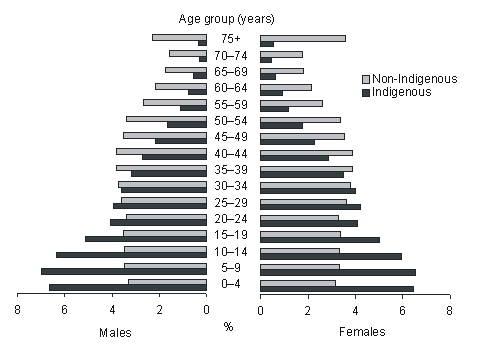
The Indigenous population is relatively young, with a median age of 21 years compared with 36 years for the non-Indigenous population. The younger age structure of the Indigenous population is shown in the following age pyramid (figure 2.1). In 2001, 39% of Indigenous people were under 15 years of age compared with 20% of non-Indigenous people. People aged 65 years or over comprised 3% of the Indigenous population and 13% of the non-Indigenous population (Appendix 1). These figures reflect higher rates of fertility and deaths occurring at younger ages among the Indigenous population. Because age is closely associated with health status, comparisons between the Indigenous and non-Indigenous populations in this publication are age standardised or presented for separate age groups wherever appropriate.
2.1 Population profile by Indigenous status, age and sex-2001

Life expectancy
The latest available expectancies of life at birth for the Indigenous population are for the period 1996-2001. At the national level, experimental estimated of Indigenous life expectancy at birth for 1996-2001 were 59 years for males and 65 years for females. This is about 17 years below the 77 years and 82 years life expectancy for all males and females respectively, for the 1998-2000 period.
Where Indigenous people live
The states with the largest Indigenous populations in 2001 were New South Wales (134,900 people or 29% of the total Indigenous population) and Queensland (125,900 people or 27% of the total Indigenous population). Other states with large Indigenous populations were Western Australia (14% of the total Indigenous population) and the Northern Territory (12%). Indigenous people comprise 29% of the Northern Territory population.
In 2001, 30% of Indigenous people lived in major cities, about 43% in regional areas and about 27% in remote areas. By comparison, approximately two-thirds (67%) of non-Indigenous people lived in major cities and only 2% lived in remote areas. As a result of these differences in distribution, the proportion of the population who were Indigenous varied from less than 1% in major cities to 58% in remote areas.
In the Northern Territory, the majority of Indigenous people lived in remote areas (81%). In contrast, more than 90% of Indigenous people in New South Wales, Victoria, Tasmania and the Australian Capital Territory lived in major cities or regional areas (table 2.2).
2.2 Estimated Resident Indigenous Population, by Remoteness Areas - 30 June 2001 |
|  |
 | Indigenous |  |  |  |
 | Major cities | Regional | Remote | Total | Indigenous | Non-Indigenous |  |
 | % | % | % | % | no. | no. |  |
|  |
| New South Wales | 42.1 | 51.6 | 6.3 | 100.0 | 134 900 | 6 440 300 |  |
| Victoria | 49.0 | 50.7 | 0.3 | 100.0 | 27 800 | 4 776 900 |  |
| Queensland | 24.8 | 51.1 | 24.1 | 100.0 | 125 900 | 3 503 000 |  |
| South Australia | 46.2 | 31.7 | 22.1 | 100.0 | 25 500 | 1 486 200 |  |
| Western Australia | 32.1 | 22.8 | 45.1 | 100.0 | 65 900 | 1 835 200 |  |
| Tasmania | . . | 96.5 | 3.5 | 100.0 | 17 400 | 454 400 |  |
| Northern Territory | . . | 18.8 | 81.2 | 100.0 | 56 900 | 140 900 |  |
| Australian Capital Territory | 100.0 | . . | . . | 100.0 | 3 900 | 315 400 |  |
| Australia | 30.2 | 43.4 | 26.4 | 100.0 | 458 500 | 18 954 700 |  |
|  |
| . . not applicable |
| ABS 2004e |
 Print Page
 Print All