Household expenditure in Western Australia
This article is published in the March Quarter 2006 issue of Western Australian Statistical Indicators, ABS cat. no. 1367.5.
OVERVIEW
Over the past few years the Western Australian economy has been booming. The community as a whole have taken advantage of this period of economic prosperity, increasing their consumer spending substantially. This analysis provides some insight into recent expenditure patterns of Western Australian households by examining results from the 2003-04 Household Expenditure Survey (HES) released in August 2005.
The results of the survey, which is conducted every five years, are used to highlight differences in spending for households with a range of social and demographic characteristics and present comparisons between the expenditure patterns of Perth and regional Western Australian households. State specific changes in consumer spending over time are also examined along with differences in expenditure patterns between Western Australia and Australia.
HOUSEHOLD EXPENDITURE ON GOODS AND SERVICES
In the 12 months to June 2004, Western Australian households spent an average of $878 each week on goods and services. This was an increase of $202 or 30% on the $676 spent per week in 1998-99. Part of this increase is due to inflation. The Consumer Price Index (CPI) for Perth rose by 16% in the five years to 2003-04. Over the same period, mean gross household income increased by 25% to $1,098 per week.
Average weekly household expenditure was marginally lower in Western Australia than for Australia in 2003-04 ($878 compared with $893). However, between 1998-99 and 2003-04 growth in spending per week was slightly higher in Western Australia (30%) than recorded nationally (28%). This was despite a smaller increase in the CPI for Perth (16%) than the weighted average for all capital cities (18%) and lesser growth in Western Australian household income (25% compared with 28%) over this period.
SELECTED INDICATORS - 1998-99 and 2003-04 |
|  |
| | Unit | Western Australia | Australia | |
| |
| Mean gross household income per week | | | | |
| 1998-99 | $ | 880 | 885 | |
| 2003-04 | $ | 1 098 | 1 128 | |
| Percentage change 1998-99 to 2003-04(a) | % | 25 | 28 | |
| Consumer Price Index | | | | |
| 1998-99 | index | 120.1 | 121.8 | |
| 2003-04 | index | 139.6 | 143.5 | |
| Percentage change 1998-99 to 2003-04(a) | % | 16 | 18 | |
| Average weekly household expenditure | | | | |
| 1998-99 | $ | 676 | 699 | |
| 2003-04 | $ | 878 | 893 | |
| Percentage change 1998-99 to 2003-04(a) | % | 30 | 28 | |
| |
| (a) Discrepancies may occur between percentage changes and component items due to rounding. |
| Source: Household Expenditure Survey, Summary of Results, cat. no. 6530.0; Consumer Price Index, Australia, cat. no. 6401.0. |
EXPENDITURE GROUPS
HOUSEHOLD EXPENDITURE IN 2003-04
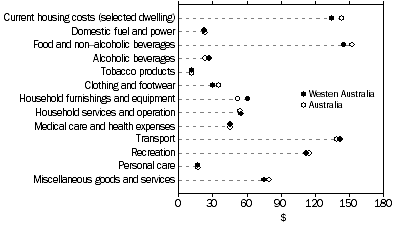
In 2003-04, the broad expenditure groups contributing most to average weekly household expenditure in Western Australia were:
- food and non-alcoholic beverages ($145 or 17% of total expenditure on goods and services);
- transport ($142 or 16%);
- current housing costs (selected dwelling) ($134 or 15%); and
- recreation ($112 or 13%).
These four categories accounted for 61% of total expenditure for Western Australian households and a similar proportion of household spending at the national level (62%). Broad expenditure categories where Western Australian households spent more than nationally included household furnishings and equipment ($61 compared to $52), alcoholic beverages ($27 compared to $23), and transport ($142 compared to $139). Food and non-alcoholic beverages ($145 compared to $153), current housing costs ($134 compared to $144) and clothing and footwear ($30 compared to $35) were expenditure groups where spending by Western Australian households was lower than the national average.
AVERAGE WEEKLY HOUSEHOLD EXPENDITURE ON GOODS AND SERVICES - 2003-04
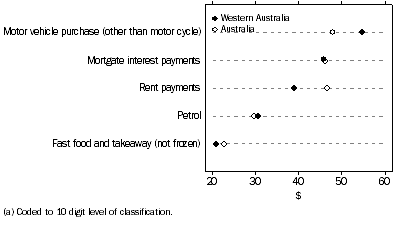
The purchase of a new or used motor vehicle is typically a large lump sum expense incurred by some households. In average weekly terms, the purchase of motor vehicles represented the single largest expenditure item for Western Australian households in 2003-04 ($55). Other high expenditure items were mortgage interest payments ($46), rent payments ($39), petrol ($31) and fast food and takeaways (not frozen) ($21). These items were also the top 5 nationally although the order was slightly different, with Australian households spending slightly more on rent payments ($47) than mortgage interest payments ($46). Western Australian households on average spent notably more on motor vehicle purchases ($55 compared to $48) but less on rent payments ($39 compared to $47).
AVERAGE WEEKLY HOUSEHOLD EXPENDITURE, Highest expenditure items(a) - 2003-04
Other detailed expenditure items on which Western Australian households spent more per week than at the national level included:
- meat (excluding fish and seafood) ($22 compared to $20);
- whitegoods and other electrical appliances ($13 compared to $9);
- beer ($13 compared to $9);
- lounge and dining room furniture ($12 compared to $9);
- mobile telephone account ($10 compared to $9); and
- dental fees ($8 compared to $6).
Among the expenditure items on which Western Australian households spent less per week than nationally were:
- meals out and fast foods ($37 compared to $42);
- vehicle servicing ($11 compared to $13);
- women's clothing ($9 compared to $10); and
- fresh fruit ($7 compared to $8).
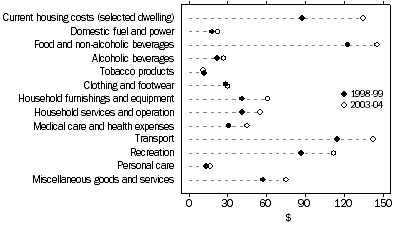
CHANGE IN EXPENDITURE BETWEEN 1998-99 AND 2003-04
Between 1998-99 and 2003-04 the fastest growing broad categories of spending by Western Australian households were:
- current housing costs up $47 (54%) to $134 per week;
- household furnishings and equipment up $20 (48%) to $61 per week;
- medical care and health expenses up $15 (48%) to $45 per week; and
- household services and operation up $14 (33%) to $55 per week.
Other categories for which there were substantial increases in weekly spending in dollar terms rather than proportional terms included transport (up $27 to $142), recreation (up $25 to $112) and food and non-alcoholic beverages (up $23 to $145). In contrast, household expenditure on tobacco products declined marginally ($0.40 or 3.6%).
AVERAGE WEEKLY HOUSEHOLD EXPENDITURE ON GOODS AND SERVICES, Western Australia
The large increase in current housing costs for Western Australian households has been attributable in part to a $23 rise in mortgage interest payments. This is likely to have been influenced by solid growth in the state's home buyer market, with the number and value of housing finance commitments increasing by 28% and 76% respectively and the share of households with a mortgage climbing from 29% to 38%. The strength of the housing sector is also likely to have contributed to the substantial increase in spending on household equipment and furnishings.
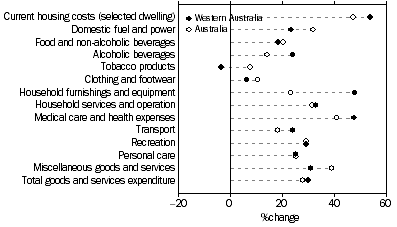
Between 1998-99 and 2003-04 changes in weekly household spending patterns differed to some extent for Western Australia and Australia. The proportional increase in spending has been more pronounced for Western Australian households than at the national level for the following expenditure categories:
- current housing costs (up 54% compared with 47%);
- household furnishings and equipment (up 48% compared with 23%);
- medical care and health expenses (up 48% compared with 41%); and
- alcoholic beverages (up 24% compared with 14%).
In contrast, Western Australian households had slower growth in their spending on domestic fuel and power (23% compared with 32%). They also had a small reduction in their expenditure on tobacco products (3.6%) compared with a 7.5% increase nationally.
PERCENTAGE CHANGE IN AVERAGE WEEKLY HOUSEHOLD EXPENDITURE ON GOODS AND SERVICES - 1998-99 to 2003-04
HOUSEHOLD CHARACTERISTICS
The level and pattern of expenditure differs between households, reflecting characteristics such as income, wealth, household composition, household size and location. In Western Australia, households with the following characteristics were among those to have higher spending:
- high income and/or wealth households;
- larger sized households;
- households with a mortgage; and
- households in Perth metropolitan area.
INCOME
Generally, households with higher levels of income have higher levels of total expenditure. In 2003-04, Western Australian households in the lowest gross income quintile (the lowest 20% of households when ranked according to gross income) spent an average of $400 compared with $1,467 for households in the highest quintile. This difference relates in part to the smaller average size of households in the lowest income quintile (1.4 persons) than the highest income quintile (3.3 persons).
The concept of equivalised disposable household income enables the economic well-being of households of different size and composition to be compared. For a lone person household, it equals their disposable income. For any household comprising more than one person, adjustment is applied to reflect the disposable income a lone person household would require to maintain the same standard of living as the household in question.
In 2003-04, Western Australian households in the lowest equivalised income quintile spent on average $511 per week on goods and services, compared with $1,306 for those in the highest quintile. Households in the lowest equivalised disposable income quintile were most likely to have government pensions and allowances as their main source of income (78%), whereas the majority from the highest quintile relied primarily on wages and salaries (88%). Those households in the lowest quintile were also smaller in size and included a large proportion of lone person households (45%). Most households in the highest quintile were family households (78%).
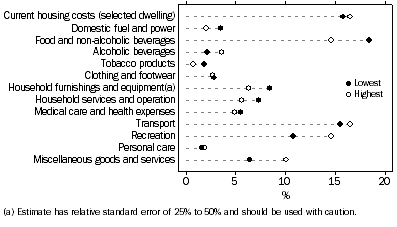
There were many differences in the composition of household expenditure for households in the lowest and highest equivalised income quintiles. Those in the lowest quintile spent proportionally more on basic goods and services including food and non-alcoholic beverages (18% compared with 15%) but less on discretionary items like recreation (11% compared with 15%).
PROPORTION OF EXPENDITURE ALLOCATED TO GOODS AND SERVICES BY LOWEST AND HIGHEST EQUIVALISED DISPOSABLE INCOME QUINTILES, Western Australia - 2003-04
HOUSEHOLD NET WORTH
Household net worth is defined as the value of a household's assets less its liabilities. As with income, the higher the net worth of a household, the higher expenditure tends to be. In 2003-04, Western Australian households in the lowest quintile according to their net worth spent on average $604 per week on goods and services, compared with $1,271 for those in the highest quintile.
For many Western Australian households the dwelling in which they live is the principal asset. In 2003-04, the majority of households in the lowest net worth quintile were renting (89%) whereas most in the highest quintile either owned (62%) or were purchasing their home (32%).
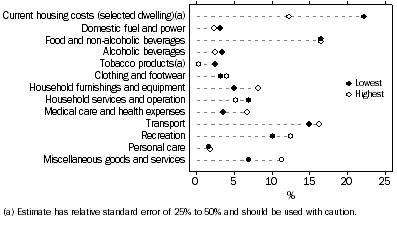
This difference in housing circumstances is reflected in the contrasting composition of household expenditure for the lowest and highest net worth quintiles. Current housing costs accounted for 22% of spending by households in the lowest net worth quintile compared with 12% for those in the highest quintile.1 For households in the highest quintile, a larger proportion of their expenditure was on recreation (12% compared with 10%), household furnishings and equipment (8.2% compared with 5.0%) and medical care and health expenses (6.7% compared with 3.5%).
1 Estimate has relative standard error of 25% to 50% and should be used with caution.
PROPORTION OF EXPENDITURE ALLOCATED TO GOODS AND SERVICES BY LOWEST AND HIGHEST NET WORTH QUINTILES, Western Australia - 2003-04
SOCIAL AND DEMOGRAPHIC CHARACTERISTICS
The levels and patterns of household income and expenditure are related to household social and demographic characteristics. In 2003-04, Western Australian households with weekly expenditure lower than the state average ($878) included:
- households who rented from the state housing authority ($361);
- lone person households ($490);
- households with government pensions and allowances as their principal source of income ($496);
- households where the reference person was aged 65 years and over ($527);2 and
- one parent households with dependent children ($719).
In contrast, households with weekly expenditure higher than the Western Australian average included:
- couple family households with dependent children ($1,168);
- households with a mortgage ($1,102);
- households where the reference person was aged 45 to 54 years ($1,069);2 and
- households with wages and salaries as their principal source of income ($1,067).
2 The reference person for each household is selected by applying various selection criteria. Details of the criteria are included in Household Expenditure Survey, Summary of Results, cat. no. 6530.0.
LOCATION
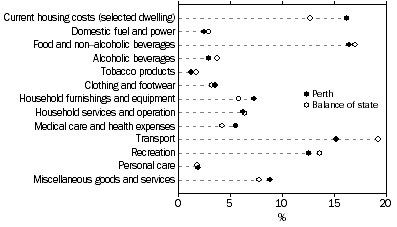
In 2003-04, average weekly household expenditure was 7.1% ($60) higher in Perth ($894) than for the balance of the state ($834). This is considerably less than the disparity recorded nationally (19% or $149) between households in capital cities ($947) and elsewhere in Australia ($798). A possible reason for this is that incomes in regional and remote areas of Western Australia are on average higher than in other parts of rural Australia due to the significance of the mining industry.
Housing and transport expenses contribute most to differences in the composition of spending for households in Perth and the rest of the state. In 2003-04, households in Perth spent a higher proportion of their expenditure on current housing costs (16% compared to 13%) and household furnishings and equipment (7.3% compared to 5.8%). In contrast, transport (19% compared to 15%) made a larger contribution to household expenditure for households elsewhere in the state.
PROPORTION OF EXPENDITURE ALLOCATED TO GOODS AND SERVICES BY PART OF STATE, Western Australia - 2003-04
When compared to the other capital cities in 2003-04, Perth households ($894) recorded higher average weekly expenditure than Adelaide ($849), Brisbane ($851) and Hobart ($881) but lower expenditure than Darwin ($1,085), Canberra ($1,064), Sydney ($1,032) and Melbourne ($945). However, between 1998-99 and 2003-04, Perth (28%) had the third fastest growth in spending of all capital cities. Only Adelaide (39%) and Hobart (36%) had household expenditure that grew at a faster rate over this period.
CONCLUSION
The level and composition of spending by Western Australian households varies considerably depending on a range of characteristics. In 2003-04 households with high income and/or net worth, larger sized households and households with a mortgage were among those with the highest levels of expenditure. In contrast, households with lower levels of income and/or net worth, lone person households and households in which the reference person was aged 65 years and over had less than average household expenditure. Households in Perth had higher expenditure than those elsewhere in Western Australia. However, the disparity between metropolitan and non-metropolitan areas was less substantial than for other states and territories.
Overall, average expenditure for Western Australian households remained marginally lower than for all Australian households in 2003-04. However, between 1998-99 and 2003-04 spending by Western Australian households grew at a faster rate than at the national level despite the state recording lower increases in CPI and average household income over this period. At the state level, growth in household expenditure was led by large proportional increases in spending on current housing costs, household furnishings and equipment and medical care and health expenses.
 Print Page
 Print All