|
|
EXPENDITURE
Recurrent expenditure for private Acute and psychiatric hospitals during 2012-13 amounted to $9.9 billion, up 5.6% from 2011-12.
Wages and salaries (including on-costs such as employer contributions to superannuation and payroll tax) represented 49.2% of recurrent expenditure in 2012-13, up from 48.6% in 2011-12. Victoria recorded the highest proportion of total recurrent expenditure spent on wages and salaries, at 50.9%, while New South Wales had the lowest proportion, at 46.4%.
The next largest component of recurrent expenditure was Drug, medical, pharmaceutical and surgical supplies, which accounted for 27.1% of the total.
The average expenditure per patient day was $1,188 in 2012-13 compared with $1,158 in 2011-12.
Table 2.15 PRIVATE ACUTE AND PSYCHIATRIC HOSPITALS, Expenditure —State and territories - 2012-13
|
 | NSW | Vic. | Qld | SA | WA | Tas., NT & ACT(a) | Aus. |
|
| Expenditure ($'000)(b) |
| Wages and salaries, including on-costs | 1,265,495 | 1,267,862 | 1,137,115 | np | 678,679 | np | 4,847,810 |
| Contract/consultancy payments for medical/health services | 117,489 | 88,933 | 63,335 | 20,946 | np | np | 379,615 |
| Drug, medical, pharmaceuticals and surgical supplies(c) | 789,948 | 620,462 | 628,996 | np | 335,984 | np | 2,668,278 |
| Food supplies | 34,577 | 34,598 | 36,762 | np | 18,389 | np | 134,585 |
| Repair and maintenance | 32,495 | 25,336 | 37,221 | np | 14,403 | np | 120,520 |
| Fuel and power | 32,304 | 26,971 | 27,117 | np | 16,512 | np | 116,224 |
| Patient transport | 1,229 | 6,071 | 240 | 770 | np | np | 10,679 |
| Depreciation and amortisation | 94,935 | 91,706 | 95,732 | np | 44,644 | np | 354,686 |
| Interest | 16,609 | 5,849 | 15,270 | np | 3,144 | np | 50,110 |
| Non-labour contract expenses | 95,372 | 121,250 | 75,431 | np | 34,918 | np | 364,267 |
| Other(d) | 247,290 | 200,398 | 156,171 | 66,840 | 117,015 | 25,356 | 813,070 |
| Total(e) | 2,727,743 | 2,489,436 | 2,273,390 | np | 1,344,941 | np | 9,859,844 |
|
| Wages and salaries, including on-costs, as a proportion of total expenditure (%) | 46.4 | 50.9 | 50.0 | np | 50.5 | np | 49.2 |
| Average expenditure ($)(f) |
| Per patient separation | 3,137 | 3,139 | 3,259 | np | 3,417 | np | 3,189 |
| Per patient day | 1,203 | 1,116 | 1,151 | np | 1,409 | np | 1,188 |
|
| Gross Capital expenditure ($'000)(g) |
| Land and buildings | 28,715 | 67,307 | 112,933 | np | np | np | 307,828 |
| Major medical equipment | 55,762 | 39,635 | 35,561 | 8,359 | np | np | 166,364 |
| Information technology | 8,023 | 5,838 | 3,959 | np | np | 525 | 21,857 |
| Other capital expenditure | 27,092 | 26,157 | 28,671 | 4,817 | np | np | 167,509 |
| Total(e) | 119,592 | 138,937 | 181,124 | 24,427 | np | np | 663,558 |
| Net Capital expenditure ($'000)(g) |
| Land and buildings | np | np | np | np | np | np | np |
| Major medical equipment | 54,832 | np | 33,301 | np | np | np | np |
| Information technology | 8,023 | np | 3,898 | np | np | 525 | 21,310 |
| Other capital expenditure | np | 22,409 | 24,588 | 4,551 | 75,324 | np | 153,311 |
| Total(e) | 114,189 | 131,600 | np | 24,157 | 184,399 | np | 644,752 |
|
np not available for publication but included in totals where applicable, unless otherwise indicated.
(a) Tasmania, the Northern Territory and the Australian Capital Territory have been aggregated to protect the confidentiality of the small number of hospitals in these states/territories.
(b) Expenditure refers to expenditure on goods and services, which does not result in the creation or acquisition of fixed assets (new or second-hand). See Glossary for further information.
(c) Including surgically implanted prostheses and homograft items.
(d) Including contract services.
(e) Figures have been rounded and discrepancies may occur between totals and the sums of the component items.
(f) Average expenditure figures can vary considerably between hospitals depending on the type of services they provide.
(g) Capital expenditure refers to expenditure in a period on the acquisition or enhancement of an asset (excluding financial assets). See Glossary for further information. |
In 2012-13, For profit Acute and psychiatric hospitals had a lower average expenditure per patient day ($1,077) than Religious or charitable Not for profit hospitals ($1,375) and Other Not for profit hospitals ($1,107).
Other Not for profit hospitals spent a slightly higher proportion of their total expenditure on wages and salaries (50.5%) than For profit hospitals and Religious or charitable Not for profit hospitals (49.7% and 48.3% respectively).
Table 2.16 PRIVATE ACUTE AND PSYCHIATRIC HOSPITALS, Expenditure — For profit/Not for profit sector(a) - 2012-13
|
| For profit | | Not for profit | Total |
| |
| |
| Religious or charitable | Other(b) | |
|
| Expenditure ($'000)(c) |
| Wages and salaries, including on-costs | 2,443,273 | 2,006,350 | 398,187 | 4,847,810 |
| Contract/consultancy payments for medical/health services | 259,935 | 95,104 | 24,576 | 379,615 |
| Drug, medical, pharmaceuticals and surgical supplies(d) | 1,308,558 | 1,179,752 | 179,968 | 2,668,278 |
| Food supplies | 62,498 | 58,767 | 13,320 | 134,585 |
| Repair and maintenance | 60,018 | 51,637 | 8,865 | 120,520 |
| Fuel and power | 58,774 | 48,316 | 9,134 | 116,224 |
| Patient transport | np | 2,133 | np | 10,679 |
| Depreciation and amortisation | 162,983 | 166,408 | 25,295 | 354,686 |
| Interest | 13,972 | 26,943 | 9,195 | 50,110 |
| Non-labour contract expenses | 152,542 | 165,629 | 46,096 | 364,267 |
| Other(e) | np | 355,664 | np | 813,070 |
| Total(f) | 4,914,609 | 4,156,703 | 788,532 | 9,859,844 |
|
| Wages and salaries, including on-costs, as a proportion of total expenditure (%) | 49.7 | 48.3 | 50.5 | 49.2 |
| Average expenditure ($)(g) |
| Per patient separation | 2,838 | 3,708 | 3,303 | 3,189 |
| Per patient day | 1,077 | 1,375 | 1,107 | 1,188 |
|
| Gross Capital expenditure ($'000)(h) |
| Land and buildings | 122,266 | 174,638 | 10,924 | 307,828 |
| Major medical equipment | 93,857 | 66,334 | 6,173 | 166,364 |
| Information technology | 7,172 | 12,880 | 1,805 | 21,857 |
| Other capital expenditure | np | 41,046 | np | 167,509 |
| Total(f) | 341,869 | 294,898 | 26,791 | 663,558 |
| Net Capital expenditure ($'000)(h) |
| Land and buildings | np | np | np | np |
| Major medical equipment | 91,095 | 64,193 | np | np |
| Information technology | 6,917 | np | np | 21,310 |
| Other capital expenditure | np | 31,340 | np | 153,311 |
| Total(f) | np | 284,064 | np | 644,752 |
|
np not available for publication but included in totals where applicable, unless otherwise indicated.
(a) For definition of 'For Profit/not for profit sector', see Glossary.
(b) Comprising bush nursing, community and memorial hospitals.
(c) Expenditure refers to expenditure on goods and services, which does not result in the creation or acquisition of fixed assets (new or second-hand). See Glossary for further information.
(d) Including surgically implanted prostheses and homograft items.
(e) Including contract services
(f) Total may include figures where providers were able to provide a total expenditure figure, without further breakdown of expenditure items, therefore the total will not equate to the sum of the individual items.
(g) Average expenditure figures can vary considerably between hospitals depending on the type of services they provide.
(h) Capital expenditure refers to expenditure in a period on the acquisition or enhancement of an asset (excluding financial assets). See Glossary for further information. |
In 2012-13, the highest recurrent expenditure per patient day (unadjusted for price changes), was recorded in hospitals with over 200 beds ($1,443). The lowest recurrent expenditure per patient day, was recorded for hospitals with 26-50 beds ($688).
The proportion of total expenditure spent on wages and salaries varied from 47.4% of expenditure for both hospitals with 0-25 beds and those with over 200 beds, to 56.9% of expenditure for hospitals with 26-50 beds.
Table 2.17 PRIVATE ACUTE AND PSYCHIATRIC HOSPITALS, Expenditure —Hospital size(a) - 2012-13
|
| Number of beds |
| 0-25 | 26-50 | 51-100 | 101-200 | Over 200 | Total(e) |
|
| Expenditure ($'000)(b) |
| Wages and salaries, including on-costs | 67,211 | 253,450 | 906,775 | 1,554,442 | 2,065,932 | 4,847,810 |
| Contract/consultancy payments for medical/health services | 5,324 | 13,855 | 63,945 | 123,775 | 172,716 | 379,615 |
| Drug, medical, pharmaceuticals and surgical supplies(c) | 33,494 | 73,704 | 373,363 | 889,041 | 1,298,676 | 2,668,278 |
| Food supplies | 1,702 | 7,763 | 24,496 | 39,587 | 61,037 | 134,585 |
| Repair and maintenance | 1,500 | 6,728 | 21,862 | 39,686 | 50,744 | 120,520 |
| Fuel and power | 2,336 | 6,919 | 23,423 | 37,813 | 45,733 | 116,224 |
| Patient transport | 130 | 368 | 1,147 | 5,279 | 3,755 | 10,679 |
| Depreciation and amortisation | 4,157 | 14,809 | 63,916 | 104,747 | 167,057 | 354,686 |
| Interest | 1,410 | 4,185 | 11,253 | 23,131 | 10,131 | 50,110 |
| Non-labour contract expenses | 6,989 | 19,740 | 58,731 | 117,611 | 161,196 | 364,267 |
| Other(d) | 17,475 | 44,226 | 129,709 | 302,244 | 319,416 | 813,070 |
| Total(e) | 141,728 | 445,747 | 1,678,620 | 3,237,356 | 4,356,393 | 9,859,844 |
|
| Wages and salaries, including on-costs, as a proportion of total expenditure (%) | 47.4 | 56.9 | 54.0 | 48.0 | 47.4 | 49.2 |
| Average recurrent expenditure ($)(f) |
| Per patient separation | 2,015 | 1,898 | 2,364 | 3,192 | 4,101 | 3,189 |
| Per patient day | 1,082 | 688 | 903 | 1,225 | 1,443 | 1,188 |
|
| Gross Capital expenditure ($'000)(g) |
| Land and buildings | 1,782 | 11,727 | 25,762 | 94,139 | 174,418 | 307,828 |
| Major medical equipment | 824 | 4,375 | 29,142 | 63,126 | 68,897 | 166,364 |
| Information technology | 398 | 1,222 | 2,892 | 5,448 | 11,897 | 21,857 |
| Other capital expenditure | 902 | 3,885 | 18,639 | 33,235 | 110,848 | 167,509 |
| Total(e) | 3,906 | 21,209 | 76,435 | 195,948 | 366,060 | 663,558 |
| Net Capital expenditure ($'000)(g) |
| Land and buildings | np | 11,727 | np | np | np | np |
| Major medical equipment | np | np | 28,857 | 61,156 | np | np |
| Information technology | np | np | np | np | np | 21,310 |
| Other capital expenditure | 304 | 2,809 | np | 27,509 | np | 153,311 |
| Total(e) | np | 19,922 | np | 189,114 | 359,357 | 644,752 |
|
np not available for publication but included in totals where applicable, unless otherwise indicated
(a) Based on number of available beds (average for the year).
(b) Refers to expenditure on goods and services, which does not result in the creation or acquisition of fixed assets (new or second-hand). See Glossary for further information.
(c) Including surgically implanted prostheses and homograft items.
(d) Including contract services.
(e) Figures have been rounded and discrepancies may occur between totals and the sums of the component items.
(f) Average expenditure figures can vary considerably between hospitals depending on the type of services they provide.
(g) Capital expenditure refers to expenditure in a period on the acquisition or enhancement of an asset (excluding financial assets). See Glossary for further information. |
When recurrent expenditure is adjusted to remove the effects of price changes over the period, the average annual increase over the five years from 2008-09 ($8.2 billion total real expenditure) to 2011-12 ($9.6 billion total real expenditure) was 4.2% (see graph in Income section).
When average expenditure per patient day is adjusted to remove the effects of price changes over the period, the average annual increase over the five years from 2008-09 ($1,114 total real expenditure per patient day) to 2012-13 ($1,153 total real expenditure per patient day) was 1.3%.
For further information on the use of chain volume measures to adjust income and expenditure, see Explanatory Note 26.
Acute and Psychiatric Private Hospitals, Expenditure(a) per patient day : 2008-09 to 2012-13
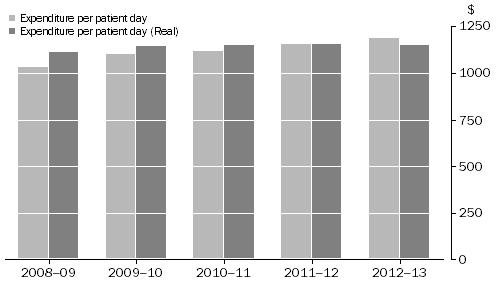 (a) Laspeyres input cost index was used to provide real expenditure. See Explanatory Note 26 for further information.
Gross capital expenditure for private Acute and psychiatric hospitals during 2012-13 was $663.6 million, an increase of 44.0% from 2011-12. Land and buildings accounted for the largest proportion (46.4%) of gross capital expenditure in 2012-13.
Table 2.18 PRIVATE ACUTE AND PSYCHIATRIC HOSPITALS Gross Capital Expenditure —State and territories—Selected years
|
| NSW | Vic. | Qld | SA | WA | Tas. NT & ACT(a) | Aus. |
|
| 2010-11(b) |
| Gross Capital expenditure ($'000)(d) |
| Land and buildings | 153,294 | 129,777 | 98,545 | np | 7,465 | np | 398,479 |
| Major medical equipment | 38,626 | 37,847 | 30,979 | np | 15,620 | np | 135,712 |
| Information technology | 7,863 | 12,617 | 4,571 | np | 2,437 | np | 28,238 |
| Other capital expenditure(e) | 43,338 | 23,666 | 23,889 | np | 6,945 | np | 108,846 |
| Total(f) | 243,121 | 203,907 | 157,984 | np | 32,467 | np | 671,275 |
|
| 2011-12(c) |
| Gross Capital expenditure ($'000)(d) |
| Land and buildings | np | np | np | np | 35,001 | np | np |
| Major medical equipment | 38,770 | 29,450 | 26,833 | 9,972 | np | np | 124,984 |
| Information technology | 5,970 | 7,411 | 3,665 | 1,083 | np | np | 19,966 |
| Other capital expenditure(e) | np | np | np | np | np | np | np |
| Total(f) | 103,026 | 112,784 | 134,374 | np | 72,025 | np | 460,859 |
|
| 2012-13 |
| Gross Capital expenditure ($'000)(d) |
| Land and buildings | 28,715 | 67,307 | 112,933 | np | np | np | 307,828 |
| Major medical equipment | 55,762 | 39,635 | 35,561 | 8,359 | np | np | 166,364 |
| Information technology | 8,023 | 5,838 | 3,959 | np | np | 525 | 21,857 |
| Other capital expenditure(e) | 27,092 | 26,157 | 28,671 | 4,817 | np | np | 167,509 |
| Total(f) | 119,592 | 138,937 | 181,124 | 24,427 | np | np | 663,558 |
|
np not available for publication but included in totals where applicable, unless otherwise indicated
(a) Tasmania the Northern Territory and the Australian Capital Territory have been aggregated to protect the confidentiality of the small number of hospitals in these states/territories.
(b) Note that capital expenditure for 2010-11 has been revised. See Explanatory Note 40 for further information.
(c) Gross and net capital expenditure was not published in 2011-12. Selected data are available in this publication. See Explanatory Note 40 for further information.
(d) Capital expenditure refers to expenditure in a period on the acquisition or enhancement of an asset (excluding financial assets). See Glossary for further information.
(e) Other capital expenditure includes construction, transport, other equipment, intangible assets and any other capital expenditure.
(f) Figures have been rounded and discrepancies may occur between totals and the sums of the component items. |
|
|
 Quality Declaration
  Print Page
 Print All