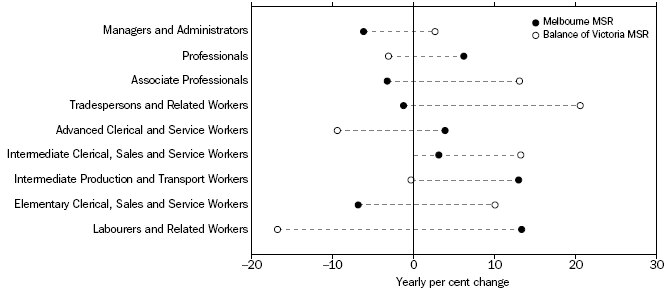
EMPLOYED PERSONS BY OCCUPATION
In August quarter 2007, there were approximately 1,821,100 persons employed full-time in Victoria. The Melbourne Major Statistical Region (MSR) accounted for 1,348,800 (74.1%) of total full-time employed persons and the Balance of Victoria MSR, 472,200 persons (25.9%).
In the Melbourne MSR over half of full-time and part-time workers were employed in three occupational categories: Professionals (23.1%), Intermediate clerical sales and service workers (16.5%) and Tradespersons (12.2%). In the Balance of Victoria, Tradespersons were the predominant group of workers (15.7%) followed closely by Professionals (15.6%) and Intermediate clerical, sales and service workers (14.4%).
Dissecting occupation by gender reveals that in the Melbourne MSR the three most predominant occupations for female employees were Professionals, Intermediate clerical sales and service and Associate professionals (26.6%, 24.8% and 12.6% respectively). For male employees, the three most predominant occupations within the same geographically defined area were Professionals, Advanced clerical and service workers and Tradespersons (20.2%, 19.3% and 12.5% respectively). In comparison, the proportion of female employees working as Professionals in Balance of Victoria was slightly lower (20.6%) and significantly lower for male employees (11.7%). The predominant occupation for females in Balance of Victoria was Intermediate clerical, sales and service (25.3%) while male employees tended to work as Tradespersons (24.4%), Intermediate production and transport workers (14.9%) and Managers and administrators (14.0%).
Full-time workers in the Melbourne MSR worked mainly as Professionals (24.5%), Intermediate clerical, sales and service workers and Advanced clerical and service workers (14.2% for both categories). In the Balance of Victoria the three most predominant occupational groups working on a full-time basis were Tradespersons (20.0%), Professionals (16.2%) and Managers and administrators (13.5%). In terms of part-time workers, in the Melbourne MSR three occupational groups comprised 61.8% of the total: Intermediate clerical, sales and service (22.1%), Associate professionals (20.1%) and Professionals (19.6%). Part-time workers in Balance of Victoria were characterised by fewer Professionals (14.5%) and tended to predominantly concentrate in the following occupations: Intermediate clerical, sales and service (21.0%) and Elementary clerical, sales and service (20.1%).
EMPLOYED PERSONS, By Occupation, Melbourne MSR and Balance of Victoria
: August quarter
- 2007

EMPLOYED PERSONS, By Occupation and Major Statistical Region - August quarter 2007 |
|  |
 | Full-Time | Part-Time |  |
 | Males | Females | Persons | Males | Females | Persons |  |
 | '000 | '000 | '000 | '000 | '000 | '000 |  |
MELBOURNE |  |
|  |
| Managers and Administrators | 95.4 | 30.7 | 126.1 | 5.1 | 6.6 | 11.7 |  |
| Professionals | 184.0 | 146.1 | 330.1 | 25.3 | 80.7 | 106.0 |  |
| Associate Professionals | 118.3 | 68.4 | 186.7 | 11.0 | 32.5 | 43.5 |  |
| Tradespersons and Related Workers | 180.4 | 11.2 | 191.6 | 19.5 | 7.2 | 26.7 |  |
| Advanced Clerical and Service Workers | 9.0 | 38.3 | 47.3 | 1.6 | 33.7 | 35.3 |  |
| Intermediate Clerical, Sales and Service Workers | 79.9 | 112.3 | 192.2 | 20.4 | 99.2 | 119.6 |  |
| Intermediate Production and Transport Workers | 107.6 | 16.0 | 123.7 | 19.1 | 9.4 | 28.5 |  |
| Elementary Clerical, Sales and Service Workers | 32.0 | 27.9 | 59.9 | 29.1 | 79.4 | 108.5 |  |
| Labourers and Related Workers | 66.4 | 24.8 | 91.2 | 32.0 | 28.5 | 60.5 |  |
BALANCE OF VICTORIA |  |
|  |
| Managers and Administrators | 49.1 | 14.5 | 63.6 | 4.8 | 5.8 | 10.6 |  |
| Professionals | 40.5 | 35.8 | 76.3 | 4.7 | 27.7 | 32.3 |  |
| Associate Professionals | 39.0 | 24.4 | 63.4 | 6.0 | 13.2 | 19.2 |  |
| Tradespersons and Related Workers | 85.5 | 9.1 | 94.6 | 8.6 | 5.7 | 14.3 |  |
| Advanced Clerical and Service Workers | - | 7.2 | 7.2 | 0.4 | 14.1 | 14.5 |  |
| Intermediate Clerical, Sales and Service Workers | 16.5 | 36.5 | 53.1 | 4.9 | 41.8 | 46.7 |  |
| Intermediate Production and Transport Workers | 50.3 | 4.9 | 55.2 | 7.1 | 2.7 | 9.8 |  |
| Elementary Clerical, Sales and Service Workers | 11.4 | 10.6 | 22.0 | 13.1 | 31.7 | 44.8 |  |
| Labourers and Related Workers | 28.7 | 8.1 | 36.8 | 15.2 | 15.1 | 30.3 |  |
VICTORIA |  |
|  |
| Managers and Administrators | 144.5 | 45.2 | 189.7 | 9.9 | 12.4 | 22.3 |  |
| Professionals | 224.5 | 181.9 | 406.5 | 29.9 | 108.3 | 138.3 |  |
| Associate Professionals | 157.4 | 92.7 | 250.1 | 17.0 | 45.7 | 62.7 |  |
| Tradespersons and Related Workers | 265.8 | 20.3 | 286.2 | 28.1 | 12.8 | 41.0 |  |
| Advanced Clerical and Service Workers | 9.0 | 45.5 | 54.6 | 2.0 | 47.8 | 49.8 |  |
| Intermediate Clerical, Sales and Service Workers | 96.4 | 148.8 | 245.2 | 25.3 | 141.0 | 166.3 |  |
| Intermediate Production and Transport Workers | 157.9 | 21.0 | 178.9 | 26.1 | 12.1 | 38.3 |  |
| Elementary Clerical, Sales and Service Workers | 43.4 | 38.6 | 81.9 | 42.2 | 111.1 | 153.2 |  |
| Labourers and Related Workers | 95.1 | 32.9 | 128.0 | 47.3 | 43.6 | 90.8 |  |
|  |
| - nil or rounded to zero (including null cells) |
| Source: ABS data available on request, Labour Force Survey. |
 Print Page
 Print All
 Print Page
 Print All