Trends in livestock slaughtered and meat produced
Cattle
Compared to June 2019:
- Cattle slaughtered remained steady at 690,700 head
- Beef production remained steady at 196,100 tonnes
Compared to July 2018:
- Cattle slaughtered increased 2.8%
- Beef production increased 1.4%
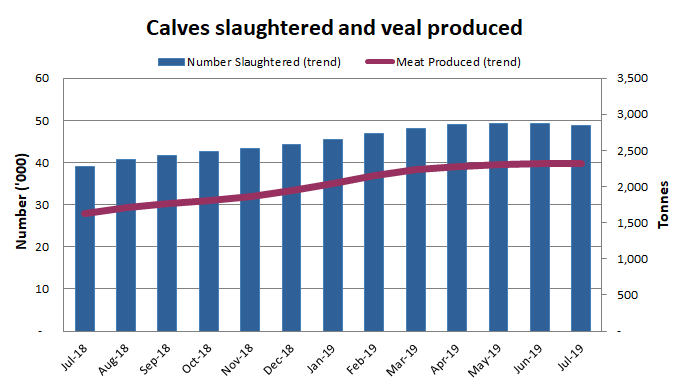
 Calves
Compared to June 2019:
- Calves slaughtered decreased 0.7% to 48,800 head
- Veal production remained steady at 2,300 tonnes
Compared to July 2018:
- Calves slaughtered increased 24.6%
- Veal production increased 41.6%
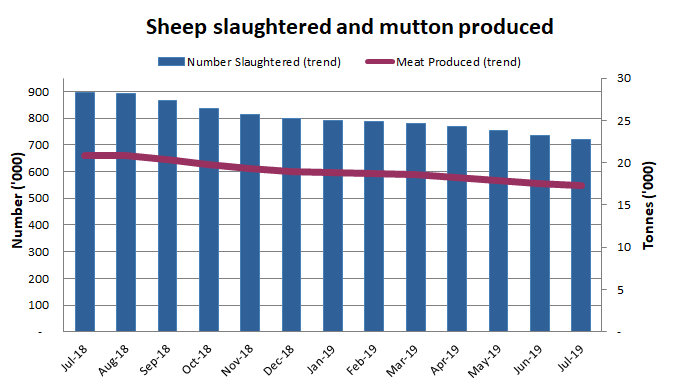
 Sheep
Sheep
Compared to June 2019:
- Sheep slaughtered decreased 2.0% to 721,300 head
- Mutton production decreased 1.5% to 17,300 tonnes
Compared to July 2018:
- Sheep slaughtered decreased 19.7%
- Mutton production decreased 17.0%
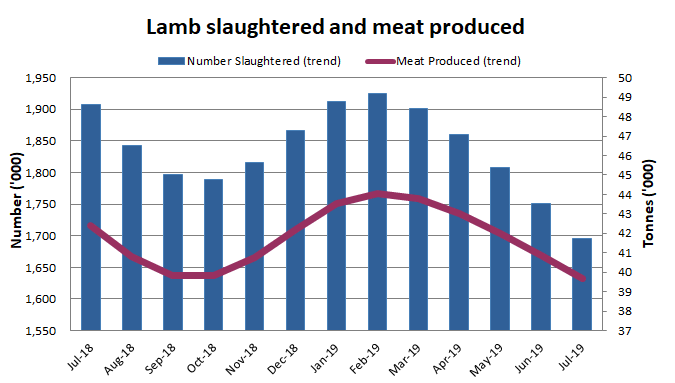
 Lamb
Lamb
Compared to June 2019:
- Lambs slaughtered decreased 3.2% to 1.70 million head
- Lamb production decreased 2.9% to 39,700 tonnes
Compared to July 2018:
- Lambs slaughtered decreased 11.1%
- Lamb production decreased 6.5%
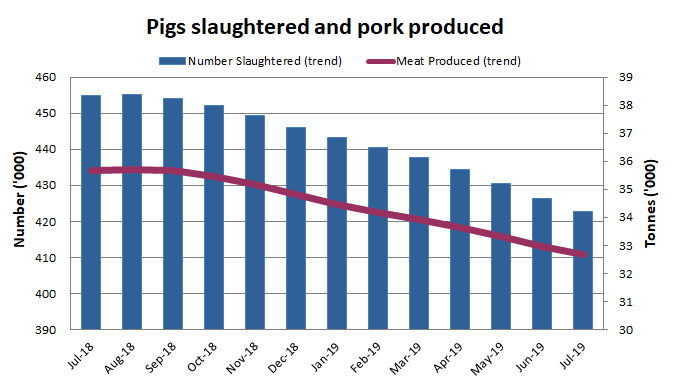
 Pigs
Pigs
Compared to June 2019:
- Pigs slaughtered decreased 0.9% to 422,700 head
- Pork production decreased 0.9% to 32,700 tonnes
Compared to July 2018:
- Pigs slaughtered decreased 7.1%
- Pork production decreased 8.4%

 Quality Declaration
  Print Page
 Print All