MARCH KEY FIGURES
 | Dec Qtr 16 to Mar Qtr 17 | Mar Qtr 16 to Mar Qtr 17 |
| % change | % change |
|
| Import Price Index all groups | 1.2 | -0.6 |
| Food and live animals | 2.2 | -2.9 |
| Beverages and tobacco | 3.0 | 0.4 |
| Crude materials, inedible, except fuels | 6.1 | 13.8 |
| Mineral fuels, lubricants and related materials | 9.2 | 36.2 |
| Animal and vegetable oils, fats and waxes | 6.2 | 12.7 |
| Chemicals and related products, n.e.s. | 1.9 | -2.7 |
| Manufactured goods classified chiefly by material | 0.2 | -4.1 |
| Machinery and transport equipment | -0.9 | -4.8 |
| Miscellaneous manufactured articles | 0.3 | -5.2 |
| Commodities and transactions, n.e.s. | -1.0 | -1.9 |
| Export Price Index all groups | 9.4 | 29.1 |
| Food and live animals | -0.4 | -0.7 |
| Beverages and tobacco | -0.4 | -8.4 |
| Crude materials, inedible, except fuels | 17.1 | 44.4 |
| Mineral fuels, lubricants and related materials | 11.0 | 59.2 |
| Animal and vegetable oils, fats and waxes | -3.9 | 10.1 |
| Chemicals and related products, n.e.s. | 3.1 | 2.2 |
| Manufactured goods classified chiefly by material | 9.7 | 20.4 |
| Machinery and transport equipment | -0.3 | -0.3 |
| Miscellaneous manufactured articles | -0.1 | -2.6 |
| Commodities and transactions, n.e.s. | 0.0 | 0.5 |
|
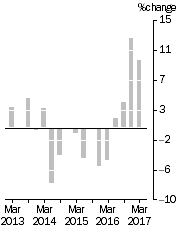
IMPORT PRICE INDEX: all groups, Quarterly % change

| EXPORT PRICE INDEX: all groups, Quarterly % change
|
MARCH KEY POINTS
IMPORT PRICE INDEX
- The Import Price Index rose 1.2% in the March quarter 2017. This follows the rise in the December quarter 2016 of 0.2%.
- The rise was driven by higher prices received for Mineral fuels, lubricants, and related materials (+9.2%) and Chemical and related products, n.e.s. (+1.9%). Offsetting these price rises were falls in Machinery and transport equipment (-0.9%) and Commodities and transactions, n.e.s. (e.g. non-monetary gold) (-1.0%).
- Through the year to the March quarter 2017, the Import Price Index fell 0.6%, driven by Machinery and transport equipment (-4.8%).
EXPORT PRICE INDEX
- The Export Price Index rose 9.4% in the March quarter 2017. This follows the rise in the December quarter 2016 of 12.4%, which was the largest rise since June quarter 2010.
- The rise was driven by higher prices received for Crude materials, inedible, except fuels (+17.1%) and Mineral fuels, lubricants, and related materials (+11.0%). Offsetting these price rises was a fall in Food and live animals (-0.4%).
- Through the year to the March quarter 2017, the Export Price Index rose 29.1%. The largest annual rise in the index since March quarter 2009.
EXCHANGE RATE
- The appreciation of the Australian dollar against major trading currencies had a downward effect on import and export prices in the March quarter 2017.
NOTES
FORTHCOMING ISSUES
| ISSUE (QUARTER) | Release Date |
| June 2017 | 27 July 2017 |
| September 2017 | 26 October 2017 |
| December 2017 | 1 February 2018 |
| March 2018 | 26 April 2018 |
INQUIRIES
For further information about these and related statistics, contact the National Information and Referral Service on 1300 135 070.
 Quality Declaration
  Print Page
 Print All