DECEMBER KEY FIGURES
 | Dec Qtr 2005 | Sep Qtr 2006 | Dec Qtr 2006 | |
| CONSOLIDATED ASSETS | $m | $m | $m | |
| |
| Superannuation funds | 496 733 | 563 879 | 596 518 | |
| Life insurance offices(a) | 197 369 | 203 227 | 209 467 | |
| Other managed funds | 259 861 | 280 418 | 289 949 | |
| Total | 953 963 | 1 047 524 | 1 095 935 | |
| |
| (a) Investments by superannuation funds which are held and administered by life insurance offices are included under life insurance offices. |
| See note on consolidation in Explanatory Notes, paragraph 10. |
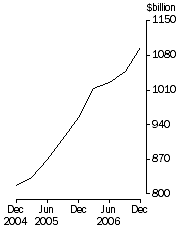
Total consolidated assets
| |
DECEMBER KEY POINTS
CONSOLIDATED ASSETS
- Total consolidated assets of managed funds institutions was $1095.9b at 31 December 2006, an increase of $48.4b (4.6%) on the revised September quarter 2006 figure of $1047.5b.
- Consolidated assets of superannuation funds increased by $32.6b (5.8%), public unit trusts were up by $8.5b (3.7%), life insurance offices up by $6.2b (3.1%), and cash management trusts up by $1.0b (2.6%). Consolidated assets of common funds and friendly societies increased marginally on their September quarter 2006 figures.
- Investment in equities and units in trusts increased by $25.7b (6.4%). Other increases were recorded in long-term securities, up $6.4b (7.4%), assets overseas, up $5.5b (2.4%), land and buildings, up $4.1b (3.5%) and cash and deposits, up $3.2b (4.3%). During the December quarter 2006, the S&P/ASX 200 rose10.0%, the price of foreign shares (represented by the US S&P 500) rose 6.2% and the $A appreciated against the $US by 5.8%. In addition the 5 year Treasury Bond yield, averaged over the three months within the quarter, increased from 5.77% to 5.90%.
- Investment managers had $1052.0b in funds under management at 31 December 2006, up $50.3b (5.0%) on the revised September quarter 2006 figure of $1001.8b. They managed $750.4b (68.5%) of the consolidated assets of managed funds institutions.
NOTES
FORTHCOMING ISSUES
| ISSUE (QUARTER) | Release Date |
| March 2007 | 30 May 2007 |
| June 2007 | 30 August 2007 |
| September 2007 | 29 November 2007 |
REVISIONS THIS ISSUE
There have been revisions in some series back to June 2006 as a result of quality assurance work undertaken with data providers.
SIGNIFICANT EVENTS
There are no significant events in this issue.
ROUNDING
Discrepancies may occur between sums of the component items and totals due to rounding.
INQUIRIES
For further information about these and related statistics, contact the National Information and Referral Service on 1300 135 070 or Sawbhag Naidu on Canberra (02) 6252 5386.
ANALYSIS
CONSOLIDATED ASSETS
By type of institution
At 31 December 2006, consolidated assets of superannuation funds were $596.5b, up $32.6b (5.8%) on the revised September 2006 figure. Consolidated assets of public unit trusts increased by $8.5b (3.7%). Consolidated assets of life insurance offices increased by $6.2b (3.1%), cash management trusts increased by $1.0b (2.6%), and the assets of common funds and friendly societies increased marginally on their September quarter 2006 figures.
By type of asset
The major asset movements for the quarter were equities and units in trusts, up $25.7b (6.4%), long-term securities, up $6.4b (7.4%), assets overseas, up $5.5b (2.4%), land and buildings, up $4.1b (3.5%) and cash and deposits, up $3.2b (4.3%).
Cross investment
The table below presents the unconsolidated, cross-invested and consolidated assets of managed funds by type of fund as at 31 December 2006.
| Unconsolidated assets | Cross- invested assets | Consolidated assets | |
| Type of fund | $m | $m | $m | |
| |
| Life insurance offices | 246 947 | 37 480 | 209 467 | |
| Superannuation funds | 797 578 | 201 059 | 596 518 | |
| Public unit trusts | 274 819 | 38 216 | 236 603 | |
| Friendly societies | 6 907 | 2 812 | 4 095 | |
| Common funds | 10 934 | 684 | 10 250 | |
| Cash management trusts | 39 000 | - | 39 000 | |
| Total | 1 376 185 | 280 251 | 1 095 935 | |
| |
| - nil or rounded to zero (including null cells) |
UNCONSOLIDATED ASSETS
Life insurance offices
At 31 December 2006, the total assets of life insurance offices were $246.9b, an increase of $7.8b (3.3%) on the revised September 2006 figure of $239.1b. The major increases were recorded in equities and units in trusts of $8.1b (4.9%), other financial assets of $1.0b (42.9%), short term securities of $0.4b (3.7%) and land and buildings of $0.2b (2.7%) Partially offsetting these were decreases in assets overseas of $1.1b (-7.3%), cash and deposits of $0.5b (-7.0%) and long term securities of $0.3b (-1.4%).
Superannuation funds
The total assets of superannuation funds held outside of life offices was $797.6b at 31 December 2006, an increase of $48.7b (6.5%) on the revised September 2006 figure. Major increases were recorded for equities and units in trusts of $32.2b (8.6%), long term securities of $6.3b (11.4%), cash and deposits of $4.2b (6.3%), assets overseas of $4.2b (2.5%), land and buildings of $1.3b (3.8%), loans and placements of $0.7b (10.8%) and short term securities of $0.1b (0.3%). A decrease was recorded for other financial assets of $0.3b (-2.7%).
Public unit trusts
The total assets for public unit trusts was $274.8b at 31 December 2006, up $10.7b (4.1%) on the revised September 2006 figure of $264.1b. The major increases were in equities and units in trusts, up $5.6b (5.8%), land and buildings, up $2.6b (3.4%), assets overseas, up $2.3b (4.6%), other non-financial assets, up $1.2b (9.9%), loans and placements, up $0.5b (5.4%), short term securities, up $0.4b (6.4%) and long term securities, up $0.1b (4.6%). There were decreases in cash and deposits of $1.2b (12.2%) and other financial assets of $0.7b (-15.5%).
Friendly societies
Total assets of friendly societies was $6.9b at 31 December 2006, up $0.1b (1.9%) on the September quarter 2006 figure. The major increase was in equities and units in trusts, up $0.1b (3.5%).
Common funds
Total assets of common funds was $10.9b at 31 December 2006, up $0.2b (2.1%) on the September quarter 2006 figure. The major increase was in cash and deposits, up $0.5b (29.4%) offset by a decrease in short term securities, of $0.6b (-14.4%).
Cash management trusts
Total assets of cash management trusts was $39.0b at 31 December 2006, up $1.0b (2.6%) on the September 2006 figure of $38.0b. Major increases were in short term securities of $0.9b (3.2%), and long term securities of $0.3b (10.7%). These were partially offset by a decrease in cash and deposits of $0.3b (-6.6%).
INVESTMENT MANAGERS
Source of funds under management
During the December quarter 2006 there was an increase in total funds under management by investment managers of $50.3b (5.0%) on the revised September quarter figure, bringing the total funds under management to $1052.0b.
The value of funds under management on behalf of superannuation funds increased by $27.0b (6.5%), public unit trusts increased by $5.5b (4.7%) and life insurance offices increased by $4.8b (3.4%).
During the quarter, the value of funds under management on behalf of sources other than managed funds increased $9.9b (4.0%). Of this, the largest increases were funds under management on behalf of other trusts, up $7.2b (5.4%) and other sources, up $2.1b (6.7%). These were partially offset by a decrease in funds sourced from other investment managers, down $0.9b (-3.1%).
The value of funds under management on behalf of overseas sources was $44.9b, an increase of $2.5b (5.9%) on the revised September 2006 quarter figure.
The value of managed funds assets invested through investment managers was $750.4b at 31 December 2006, representing 68.5% of the consolidated assets of managed funds.
 Print Page
 Print All