NOTES
ABOUT THIS PUBLICATION
This publication presents results from the Family Characteristics Survey conducted in June 2003. It presents information about the composition of households and families, and the characteristics and circumstances of people within them.
ABOUT THIS SURVEY
The 2003 Family Characteristics Survey (FCS) was conducted throughout Australia as part of the Australian Bureau of Statistics (ABS) Monthly Labour Force Survey (LFS). The 2003 FCS is the fourth survey on the topic of family composition, the first being conducted in 1982.
This survey collected details on household and family composition including demographic, labour force, and family type. A particular focus of the survey is families with children aged 0-17 years. The additional information collected for these families included information about family structure, the social marital status of the parents, parental income and contact arrangements for children with non-resident parents.
Comparison with data obtained from the 1992 Family Survey and the 1997 Family Characteristics Survey helps to show how the number and proportions of various family types have changed over the last decade.
ROUNDING
As estimates have been rounded, discrepancies may occur between sums of the component items and totals.
INQUIRIES
For further information about these and related statistics, contact the National Information and Referral Service on 1300 135 070 or Family Characteristics Survey Team on Canberra (02) 6252 6682.
SUMMARY OF FINDINGS
INTRODUCTION
Most Australians live in households as members of a family unit. The numbers of families of different types, reflect patterns of partnering and marriage and subsequent differences in family formation. The ageing of the population, too, has an impact on family composition. This publication presents results of the 2003 Family Characteristics Survey (FCS) and compares them to the 1997 FCS and the 1992 Family Survey, providing information about the changing patterns of family and household composition in contemporary Australia.
In 2003, there were 7.6 million households, of which 71% (or 5.4 million) were family households. This proportion is slightly higher than in 1997 (70%) but lower than in 1992 (74%).
Reflecting the fact that the majority of households in Australia were family households in 2003, most people (87%) lived in family households. A further 10% lived alone and the remainder (4%) lived with unrelated individuals (i.e. in group households).
The proportion of people who lived in family households (87% in 2003) was slightly higher than that measured in 1997 (86%) but lower than that recorded in 1992 (89%). Similarly, the proportion of people living alone in both 1997 and 2003 (10%) was higher than in 1992 (8%).
FAMILY HOUSEHOLDS AND FAMILIES
There were 5.5 million families in Australia in 2003. Most lived as one family households while 4% (213,800) of families lived in multi-family households. The average size of family households was 3.1 persons in both 1997 and 2003, down from 3.3 persons in 1992.
Families are characterised by the presence of certain relationships, such as couple relationships, parent-child relationships and other blood relationships. Therefore, families may be comprised of couples with or without children of any age, lone parents with children of any age, or other families (i.e. families of related adults, where no couple or parent/child relationship exists such as brothers or sisters living together). Of all families in 2003, 84% (4.6 million) were couple families, 14% (799,800) were one parent families and 2% (98,900) were other families. (See diagram on page 4).
Families with children
Families with children made up 60% of all families. These can be grouped into families with dependent children (i.e. families with a child being aged less than 15 years or a full-time dependent student aged 15-24 years) and families with non-dependent children only. Of all families with children, 79% had dependent children, while 21% had non-dependent children only. The proportion of all families with children with very young children (with the youngest child aged 0-2 years) has decreased from 23% in 1992 to 22% in 1997 and 20% in 2003.
A further group of interest among families with children are those with children aged 0-17 years, because children aged less than 18 years have not attained full adult rights so usually remain reliant in some ways on either their parent(s) or guardian(s). In 2003, there were 2.5 million families with at least one child aged 0-17 years (45% of all families). Of these families, 78% were couple families and 22% were one parent families. (See diagram on page 6).
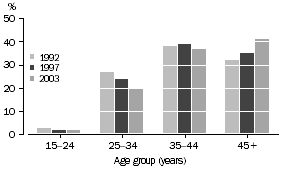
The age profile of parents in couple families with children in 2003 has changed since 1992 and 1997, with lower proportions in younger age groups and higher proportions in older age groups. In 2003, 20% of parents in couple families were aged 25-34 years, down from 24% in 1997 and 27% in 1992. Conversely, 41% of parents in couple families were aged 45 years and over in 2003, compared with 35% and 32% in 1997 and 1992 respectively. (See graph below).
Age of parents in couple families with children

Labour force status
For over half (60%) of couple families with dependent children (those with children aged less than 15 years or full-time dependent students aged 15-24 years) both parents were employed. The likelihood of both parents being employed tended to increase with the age of the youngest dependent child, from 45% in families where the youngest child was aged 0-2 years to 67% where the youngest dependent child was a full-time student aged 15-24 years. Of the 698,800 couple families with dependent children where only one parent was employed, the employed parent was the father in 89% of cases.
In 2003, 52% of lone parents with dependent children were employed and of these just over half (52%) were employed full time. As with couple families, lone parents with older children were more likely to be employed than those with younger children - 76% were employed in families where the youngest dependent child was a full-time student aged 15-24 years compared to 28% where the youngest child was aged 0-2 years.
Of all dependent children in 2003, 753,600 (15%) were in families without an employed parent. Almost two-thirds of these children (64% or 482,100) were in one parent families.
FAMILIES WITH CHILDREN AGED 0-17 YEARS
Family structures
Of all families with children, those with children aged 0-17 years are discussed as children in this age group living with a parent/guardian usually remain the responsibility of their parent(s)/guardian(s), having not yet attained the full legal status afforded to adults (e.g. the right to vote or the right to marry without parental consent). There were 2.5 million families with at least one child aged 0-17 years in 2003. The majority, 1.8 million (71%), were intact couple families (see Glossary for a full definition), 542,600 (22%) were one parent families, with 176,700 families being step or blended families. A further 14,900 were classified as other families (see Glossary). (See diagram on page 6).
Step families (98,600 or 4% of all families with children aged 0-17 years) are those formed when parents repartner following separation, and where there is at least one step child of either member of the couple present. To be counted as a blended family, a family must contain a step child but also have a child born to both parents. In 2003, there were 78,100 blended families representing 3% of all families with children aged 0-17 years. This proportion is the same as that recorded in 1992 and 1997.
As a proportion of all families with children aged 0-17 years, one parent families increased from 17% in 1992 to 21% in 1997, but remained at the same level in 2003 (22%).
Marital status of parent(s)
Of all couples with children aged 0-17 years, 12% were in a de facto marriage in 2003. Couples in both step (56%) and blended families (39%) were more likely than those in intact families (8%) to be in a de facto marriage.
Of the 542,600 lone parents of children aged 0-17 years, 35% reported that they had never married. Of lone parents who had ever been married, 51% were divorced, 38% were separated, with the remainder being widowed (8%) or reporting their status as still married (2%). Lone mothers were more likely to have been never married than lone fathers (38% and 15% respectively).
PARENTAL INCOME
Couple families with children aged 0-17 years
In 2003, the median weekly parental income for couple families with children aged 0-17 years was $1,167. The median weekly income generally increased with the age of the youngest child, up from $1,053 for those whose youngest child was aged 0-2 years to $1,292 for those whose youngest child was aged 15-17 years. The median weekly parental income for intact and step families was $1,186 and $1,169 respectively, compared with $985 for blended families (where the children were more likely to be younger). The majority of couple families with children aged 0-17 years (72%) had wages or salary as their main source of income.
One parent families with children aged 0-17 years
The median weekly income of lone parents with children aged 0-17 years was $412, less than half the income of parents in couple families with children ($1,167 per week). In 2003, 58% of lone parents received a government pension, benefit or allowance as their main source of income compared to 8% of couples with children aged 0-17 years.
As with the income of parents in couple families, the income of lone parents generally increased with the age of the youngest child. For lone parents the median weekly income of the parent increased from $390 for those whose youngest child was aged 0-2 years, up to $575 for those whose youngest child was aged 15-17 years. Lone fathers tended to have higher incomes than lone mothers, with median weekly incomes of $550 and $400 respectively.
CHILDREN AGED 0-17 YEARS WITH A NATURAL PARENT LIVING ELSEWHERE
There were 1.1 million children aged 0-17 years in 2003 (23% of all children in this age group) who had a natural parent living elsewhere. Of these children, 76% lived in one parent families, 13% in step families and 9% in blended families. Children were more likely to live with their mother than their father after parents separate. The survey found that in 84% of cases it was the father who was the natural parent living elsewhere.
Contact arrangements
Of the children aged 0-17 years with a natural parent living elsewhere, 50% (or 543,500) saw their other parent frequently (at least once per fortnight), while 31% (339,000) only saw their other natural parent either rarely (once per year, or less often) or never. Of the 283,000 children who saw their other natural parent less than once a year or never saw them, 64,300 (23%) had some indirect contact with their parent (e.g. via phone, email, or letter).
The proportion of children whose mother or father lived elsewhere who saw their other parent frequently increased from 44% in 1997 to 50% in 2003.
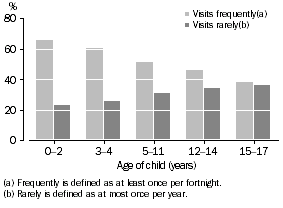
Children seeing another natural parent, Proportion of children seeing other natural parent frequently/rarely

Younger children were likely to see their other natural parent more frequently than were older children. Of children aged 0-2 years, 66% saw their other natural parent frequently while 23% saw them rarely or never. The corresponding proportions for children aged 15-17 years were 38% and 36% respectively. (See graph above).
On average, 50% of children with a parent living elsewhere in 2003 had overnight stays with the other natural parent, compared with 46% in 1997. The proportion of children staying for 30% or more nights (equivalent to an average of 2 nights per week) with the other natural parent was higher in 2003 (6%) compared with 3% in 1997.
GRANDPARENT FAMILIES
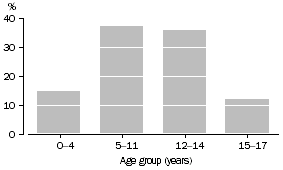
There were 22,500 grandparent families with children aged 0-17 years in Australia in 2003. These families represented around one percent of all families with children aged 0-17 years. The majority of grandparent families (73%) reported the age of the youngest child was between 5 and 14 years. (See graph below).
Grandparent families by age of youngest child

In 39% of grandparent families, the younger partner or lone grandparent was younger than 55 years, while in the majority (61%) of grandparent families, the younger partner or lone grandparent was aged 55 years or more.
In around one-third (34%) of grandparent families, one or both grandparents were employed, and 62% received a government pension, benefit or allowance as their main source of income. Over two-thirds (71%) of the 31,100 children in grandparent families saw their natural parent(s) living elsewhere.
NON-RESIDENT PARENTS
Of the 493,200 non-resident parents (i.e. those parents with children aged 0-17 years living with the other natural parent), most (82%) were fathers. As indicated by their relationship in the household in which they lived, 40% of the fathers had formed new relationships, while 32% of them lived alone. Other non-resident fathers lived as dependent students (7.8%), in group households (7.7%) and as lone parents (6.4%). Of non-resident mothers, 48% had formed new relationships, 33% were lone parents, and only 10% lived alone.
 Print Page
 Print All