CDEP PARTICIPATION
Census output for CDEP participation only reflects information collected on Interviewer Household Forms (IHFs). These forms contained a separate question for CDEP whereas the standard Census form was not designed to collect information on CDEP participation. Therefore, similar to 2001, CDEP participants identified in the 2006 Census were only counted as part of the enumeration procedures used in remote communities, and in some discrete Indigenous communities in non-remote areas.
There were 14,200 Indigenous CDEP participants identified in the 2006 Census. The aim of CDEP is to create local employment opportunities in remote Indigenous communities, with a particular focus on community development, where the labour market might not otherwise offer employment.
Of Indigenous CDEP participants counted in the 2006 Census:
- the majority were in Very Remote areas (76%) and a further 14% were in Remote areas
- the largest proportion were in the Northern Territory (37%), followed by Queensland (32%)
- Indigenous people aged 15-24 years old were most likely to be CDEP participants (29%), followed by those aged 25-34 years (27%)
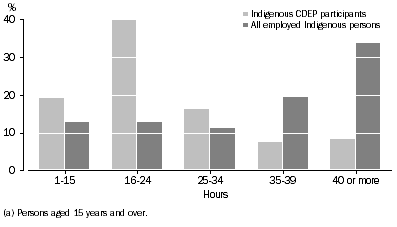
- three-quarters (75%) worked part-time hours (between 1 hour and 34 hours) in the week prior to Census
- two in five (40%) worked between 16 and 24 hours in the week prior to Census
- 13% had a non-school qualification
- 12% worked in high or medium skill occupations.
Compared with all Indigenous people who were employed, Indigenous people identified as CDEP participants were:
- twice as likely to report working part-time hours (75% compared with 39%)
- more likely to report working in a low skill occupation (78% compared with 60%)
- one-third as likely to report a non-school qualification (13% compared with 37%).
Hours worked(a), Indigenous persons

 Print Page
 Print All
 Print Page
 Print All