LABOUR FORCE STATUS
Employed people
In 2006-07, there were an estimated 188,100 employed people in the ACT, an increase of almost 4% on those employed during 2005-06 (181,400) and an increase of 5% on those employed during 2004-05 (178,700).
Of the employed people in the ACT during 2006-07, 52% were male and 48% were female. Of the total employed persons, 75% (141,900) worked full-time.
Eighty-five per cent of employed males in the ACT worked full-time, compared with 65% of employed females.
10.1 Labour force status (aged 15 and over), ACT - Financial year averages: Original |
|  |
| | Employed
full-time | Total
employed | Total
unemployed | Unemployment
rate | Participation
rate | Civilian
population
aged 15 years
and over | |
| | '000 | '000 | '000 | % | % | '000 | |
| |
| Males | | | | | | | |
| 2004-05 | 78.6 | 92.1 | 3.8 | 3.9 | 76.6 | 125.2 | |
| 2005-06 | 80.1 | 94.6 | 3.3 | 3.3 | 77.3 | 126.6 | |
| 2006-07 | 83.1 | 97.5 | 3.2 | 3.1 | 78.4 | 128.4 | |
| Females | | | | | | | |
| 2004-05 | 53.8 | 86.6 | 2.7 | 3.0 | 67.4 | 132.4 | |
| 2005-06 | 55.2 | 86.8 | 2.8 | 3.2 | 67.2 | 133.4 | |
| 2006-07 | 58.8 | 90.6 | 2.6 | 2.8 | 69.0 | 135.1 | |
| Persons | | | | | | | |
| 2004-05 | 132.4 | 178.7 | 6.5 | 3.5 | 71.9 | 257.6 | |
| 2005-06 | 135.3 | 181.4 | 6.1 | 3.3 | 72.1 | 260.0 | |
| 2006-07 | 141.9 | 188.1 | 5.7 | 3.0 | 73.6 | 263.5 | |
| |
| Labour Force, Australia, Spreadsheets, Sep 2007 (cat. no. 6202.0.55.001). |
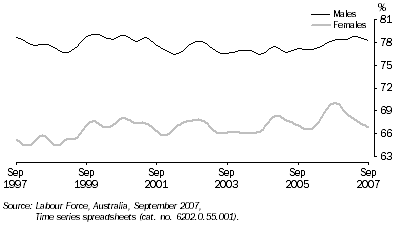
Participation rates
The ACT's trend labour force participation rate continues to be one of the highest of any Australian state or territory. At September 2007, the ACT recorded the second highest participation rate (72.5%), behind that for Northern Territory (73.5%). The national trend participation rate was 65.0%. The ACT's male trend participation rate at September 2007 was 78.4% and for females was 66.8%. While male labour force participation rates have remained relatively stable over recent years, female participation rates have fluctuated more widely.
10.2 Labour force participation rate, By sex
- ACT
: Trend series
- 1997-2007
Unemployment
The ACT's trend unemployment rate at September was 2.5%, slightly lower than those for September 2006 (2.9%) and September 2005 (3.3%). Apart from peaks around October/November 1997 (8.0%) and May/June 2001 (5.6%), the trend unemployment rate for the ACT has generally declined over the past decade. The national trend unemployment rate at September 2007 was 4.2%.
10.3 Unemployment rate, ACT and Australia
: ^Trend series
- 1997-2007
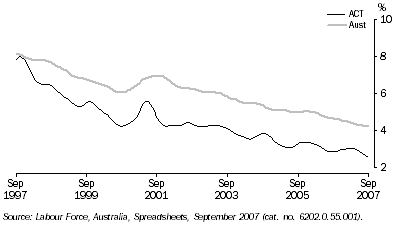
At September 2007, there were an estimated 4,900 unemployed persons (trend terms) in the ACT, comprising 2,500 males and 2,400 females. This was a decrease from September 2006 (5,500 unemployed persons) and also from September 2005 (6,200 unemployed persons).
Underutilised labour
The unemployed represent just one measure of underutilised labour, and while the unemployment rate is the key measure of available labour resources which are not being utilised in the economy, no single measure can fully capture the complexity of the labour market nor satisfy all the purposes for which data are needed.
The amount of underutilisation, or spare capacity, in the labour supply is important for economic policy due to its potential to contribute to the production of goods and services. Labour underutilisation is also an important social policy issue as the lack of sufficiently paid work may have a significant impact on the financial, personal and social lives of both individuals and their families.
The ABS has a series of supplementary measures of labour underutilisation that provide a broad view of existing and potential labour resources, and the extent to which they are being utilised. These take into account, in addition to the unemployed, people who are underemployed and those with a marginal attachment to the labour force (particularly discouraged job seekers). The head count measures give an indication of the proportion of the population affected by labour underutilisation, while the volume measures may be more relevant for analysing spare capacity in the labour force.
10.4 Measures of labour underutilisation, ACT and Australia: Original series - September |
| |
| | Unemployment rate(a) | Labour force underutilisation rate(b) | Extended
labour force underutilisation
rate(c) | Volume
unemployment
rate(d)(e)(f) | Volume
underemployment
rate(d)(g) | Volume
labour force underutilisation
rate(d)(h) | |
| | % | % | % | % | % | % | |
| |
| Australian Capital Territory | | | | | | | |
| 2002 | 4.2 | 8.0 | 9.0 | 3.2 | 1.7 | 4.8 | |
| 2003 | 3.9 | 8.5 | 9.1 | 3.0 | 1.9 | 4.9 | |
| 2004 | 4.2 | 8.3 | 9.2 | 3.3 | 1.4 | 4.7 | |
| 2005 | 2.9 | 6.2 | 6.8 | 2.1 | 1.2 | 3.3 | |
| 2006 | 2.6 | 6.5 | 6.7 | 1.7 | 1.5 | 3.1 | |
| Australia | | | | | | | |
| 2002 | 6.4 | 12.1 | 13.1 | 5.3 | 2.4 | 7.8 | |
| 2003 | 5.9 | 11.5 | 12.5 | 5.0 | 2.4 | 7.4 | |
| 2004 | 5.5 | 11.1 | 12.2 | 4.4 | 2.3 | 6.8 | |
| 2005 | 5.1 | 10.5 | 11.4 | 4.2 | 2.2 | 6.4 | |
| 2006 | 4.8 | 9.8 | 10.6 | 3.8 | 2.1 | 5.9 | |
| |
| (a) The unemployed as a proportion of the labour force. |
| (b) The unemployed, plus the underemployed, as a proportion of the labour force. |
| (c) The unemployed, plus the underemployed, plus a subset of persons marginally attached to the labour force, as a proportion of the labour force augmented by the marginally attached persons. |
| (d) Volume measures of labour underutilisation are experimental. |
| (e) The volume of potential labour in the labour force is equal to the preferred hours of unemployed persons, plus the preferred hours of underemployed workers (both utilised and unutilised), plus the hours of labour usually provided by employed persons who are not underemployed. |
| (f) The hours of labour sought by unemployed persons, as a percentage of the volume of potential labour in the labour force. |
| (g) The additional hours of labour offered by underemployed workers as a percentage of the volume of potential labour in the labour force. |
| (h) The total volume of underutilised labour in the labour force (hours sought by those in unemployment, plus additional hours offered by those in underemployment), as a percentage of the volume of potential labour in the labour force. |
| Australian Labour Market Statistics, Labour Force Survey, Survey of Job Search Experience and Survey of Underemployed Workers, Data available on request. |
 Print Page
 Print All