This section provides information on government services that provide care and support to older people who are living in the community or who are in formal residential aged care.
Residential aged care is funded by the Australian Government and provides accommodation and other support services, such as domestic assistance, personal care and nursing care. Community Aged Care Packages are also Australian Government funded, and support people who prefer to remain at home but who require care equivalent to low level residential care. The Home and Community Care Program (HACC) is jointly funded by Australian and state and territory governments. It provides community-based support services, such as home nursing, personal care, respite care, domestic help, meals and transport to people who can be appropriately cared for in the community and can therefore remain at home.
Although these services are commonly associated with older people, a proportion of younger people also utilise such services. This occurs relatively more often among Indigenous Australians because of the higher prevalence of chronic diseases. For example, Type II diabetes, cardiovascular diseases and kidney disease often have earlier onset among Indigenous people, resulting in a relatively high proportion of Indigenous people needing care at a younger age. Also, a higher proportion of Indigenous Australians die at younger ages, with the life expectancy at birth about 18 years less than that of all Australians. The Commonwealth’s Aged Care Act 1997 recognises the implications of these differences in health status and life expectancy between the two population groups. When planning services for older people, the Australian Government uses population estimates for the general population aged 70 years or over, compared with 50 years or over for Indigenous Australians (DHAC 2001).
In developing programs to meet the care needs of older people, particular consideration is given to issues of access and equity for groups with special needs, such as Indigenous Australians. The Aboriginal and Torres Strait Islander Aged Care Strategy was developed in 1994 after consultation with Indigenous communities and organisations involved in aged care services. This Strategy tackles issues of access to services, including those related to the rural and remote location of many Indigenous communities. The Strategy established Aboriginal and Torres Strait Islander Flexible Services, which provide aged care services with a mix of residential and community care places that can change as community needs vary. Many of these services have been established in remote areas where no aged care services were previously available.
In rural and remote locations that are too small to support the standard systems of aged care provision, Multi-purpose Services provide a more workable care and treatment model by bringing together a range of local health and aged care services, often including residential aged care, under one management structure. Multi-purpose Services provide flexible care places.
Residential aged care services
At 30 June 2004, there were 29 residential services operating under the Aboriginal and Torres Strait Islander Aged Care Strategy, providing 336 places for Indigenous residents (AIHW 2005l). No demographic data are available for clients of these services.
There were 154,487 places in mainstream residential aged care services as at 30 June 2004. Of these, 809 permanent residents (0.6% of all permanent residents) and 19 people in respite care (0.7% of all people in respite care) identified as being of Aboriginal or Torres Strait Islander origin. Indigenous status was not recorded or not known for 10,967 (7%) of all residents (AIHW 2005l).
Age profile
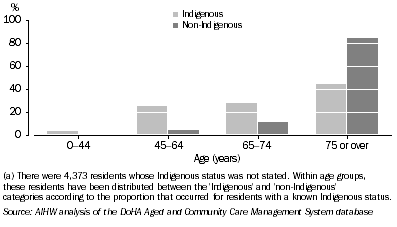
Of those who were admitted to permanent or respite care during 2003-04, proportionately more Indigenous people were in the younger age groups (graph 11.14). Almost 29% of Indigenous people were under 65 years of age on admission to residential aged care, compared with fewer than 5% of non-Indigenous Australians. About 44% of Indigenous Australians were aged 75 years or over on admission, compared with 84% of non-Indigenous Australians.
11.14 Age profile of residential aged care admissions(a), by Indigenous status - 1 July 2003 to 30 June 2004

Usage rates
Age-specific usage rates show that Indigenous Australians make higher use of residential aged care services at relatively younger ages (table 11.15). At 30 June 2004, 9 per 1,000 Indigenous people aged 50-74 years were in residential aged care, compared with 4 per 1,000 non-Indigenous Australians. Among people aged 75 or over, 103 per 1,000 Indigenous people and 104 per 1,000 non-Indigenous people were in residential care.
11.15 Residential aged care use(a), by Indigenous status and age(b) - 30 June 2004 |
|  |
 | Residents | Age-specific usage rate per 1,000(c) |  |
| Age (years) | Indigenous | Non- Indigenous | Total | Indigenous | Non- Indigenous | Total |  |
|  |
| Less than 50 | 71 | 951 | 1 022 | 0.2 | 0.1 | 0.1 |  |
| 50-74 | 425 | 18 380 | 18 805 | 8.9 | 3.9 | 3.9 |  |
| 75 or over | 408 | 127 405 | 127 813 | 102.8 | 103.6 | 103.6 |  |
| Total | 904 | 146 736 | 147 640 | . . | . . | . . |  |
|  |
| . . not applicable |
| (a) Places provided by multi-purpose services and services receiving flexible funding under the Aboriginal and Torres Strait Islander Aged Care Strategy are not included, as age-specific figures are not available for these programs. |
| (b) Includes 10,967 residents whose Indigenous status was not stated. Within age groups, these residents have been distributed between the ‘Indigenous’ and ‘non-Indigenous’ categories in accordance with the proportion that occurred for residents with a known Indigenous status. |
| (c) Based on the ABS 'low series' population projections. |
| AIHW analysis of the DoHA Aged and Community Care Management Information System database. |
Community Aged Care Packages
At 30 June 2004, there were 29 Community Aged Care Packages services operating under the Aboriginal and Torres Strait Islander Aged Care Strategy, providing 243 packages to Indigenous clients (AIHW 2005h). No demographic data are available for clients of these services.
Out of a total of 27,657 people receiving mainstream Community Aged Care Packages at 30 June 2004, 1,113 (4%) identified as being of Aboriginal or Torres Strait Islander origin. Indigenous status was not known for 1.3% of care recipients.
Age profile
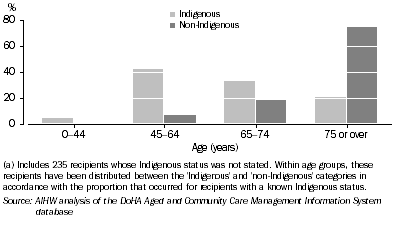
Of people receiving assistance, proportionately more Indigenous recipients were in the younger age groups (graph 11.16). About 46% of Indigenous care recipients were under 65 years of age, compared with fewer than 8% of non-Indigenous care recipients. About 20% of Indigenous care recipients were aged 75 years or over, compared with 74% of non-Indigenous care recipients.
11.16 Age profile of Community Aged Care Package recipients(a), by Indigenous status - 30 June 2004

Usage rates
Use of Community Aged Care Packages is higher among Indigenous Australians than non-Indigenous Australians in all age categories examined. At 30 June 2004, there were 16 per 1,000 Indigenous clients aged 50-74 years, compared with 1 per 1,000 non-Indigenous Australian clients in the same age group (table 11.17). There were 71 per 1,000 Indigenous Australians aged 75 years or over and over using Community Aged Care Packages, compared with 17 per 1,000 non-Indigenous Australians.
11.17 Community Aged Care Package recipients(a), by Indigenous status and age(b) - 30 June 2004 |
|  |
 | Residents | Age-specific usage rate per 1,000(c) |  |
| Age (years) | Indigenous | Non- Indigenous | Total | Indigenous | Non- Indigenous | Total |  |
|  |
| Less than 50 | 70 | 171 | 241 | 0.2 | - | - |  |
| 50-74 | 760 | 5 171 | 5 931 | 15.9 | 1.1 | 1.2 |  |
| 75 or over | 283 | 21 202 | 21 485 | 71.1 | 17.2 | 17.4 |  |
| Total | 1 113 | 26 544 | 27 657 | . . | . . | . . |  |
|  |
| . . not applicable |
| - nil or rounded to zero (including null cells) |
| (a) Recipients provided packages by Multi-Purpose Services and services receiving flexible funding under the Aboriginal and Torres Strait Islander Aged Care Strategy are not included, as age-specific figures are not available for these programs. |
| (b) Includes 235 recipients whose Indigenous status was not stated. Within age groups, these recipients have been distributed between the ‘Indigenous’ and ‘Non-Indigenous’ categories in accordance with the proportion that occurred for recipients with a known Indigenous status. |
| (c) Based on the ABS 'low series' population projections. |
| AIHW analysis of the DoHA Aged and Community Care Management Information System database. |
Home and Community Care Program
The HACC Minimum Data Set (MDS) collects data on the Indigenous status of its clients. Since implementation of the collection in January 2001, improvements have been made in the quality and comprehensiveness of the HACC MDS data.
During 2003-04 approximately 3,500 organisations provided HACC-funded services to clients across Australia, of which about 83% submitted data. Among participating agencies, HACC services were provided to about 707,200 clients of all ages (table 11.19). Of these, just over 2.4% (about 17,000) were reported to be Indigenous clients, ranging from over 42% in the Northern Territory to 1% in Victoria. Indigenous status was not recorded or not known for 11% of HACC clients.
Age profile
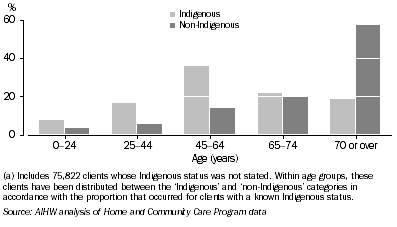
Analysis of HACC MDS data suggests that Indigenous HACC clients had a younger age profile than non-Indigenous clients (graph 11.18). About 60% of Indigenous clients were under 65 years of age, compared with 23% of non-Indigenous clients. About 18% of Indigenous clients were aged 75 years or over, compared with 57% of non-Indigenous clients.
11.18 Age profile of Home and Community Care Program clients(a), by Indigenous status - 2003-2004

Usage rates
The HACC program was used by a higher proportion of Indigenous Australians than non-Indigenous Australians in all age groups examined. At 30 June 2004, there were 184 per 1,000 Indigenous clients aged 50-74 years, compared with 45 per 1,000 non-Indigenous clients in the same age group (table 11.19). There were 773 per 1,000 Indigenous clients aged 75 years or over using HACC services, compared with 321 per 1,000 non-Indigenous clients.
The high usage rate of HACC services among the Indigenous population aged 75 years or over (table 11.19), reported at 773 per 1,000 Indigenous clients, should be treated with some caution. For some age groups in a couple of states and territories, the number of HACC clients identified as Indigenous were close to, or greater than, the ABS estimates of the corresponding Indigenous population. This suggests that Indigenous status was not well recorded in the HACC MDS in those states and territories. This could occur if repeat clients provided different name or birth date information to different HACC agencies, resulting in their being counted more than once. In addition, the usage rate might also be inflated if people were more inclined to identify themselves as Indigenous in the HACC collection than in the 2001 Census.
11.19 Home and Community Care Program clients(a), by Indigenous status and age - 2003-04 |
|  |
 | Clients | Age-specific usage rate per 1,000(b) |  |
| Age (years) | Indigenous | Non- Indigenous | Total | Indigenous | Non- Indigenous | Total |  |
|  |
| Less than 50 | 5 200 | 79 600 | 84 900 | 12.1 | 5.8 | 6.0 |  |
| 50-74 | 8 800 | 215 700 | 224 500 | 184.3 | 45.4 | 46.8 |  |
| 75 or over | 3 100 | 394 800 | 397 800 | 772.6 | 321.1 | 322.5 |  |
| Total(c) | 17 100 | 690 100 | 707 200 | . . | . . | . . |  |
|  |
| . . not applicable |
| (a) Data include 10.9% of clients whose Indigenous status was not stated. Within age groups, these clients have been distributed between the ‘Indigenous’ and ‘Non-Indigenous’ categories in accordance with the proportion that occurred for clients with a known Indigenous status. |
| (b) Based on the ABS ‘low series’ population projections. This method results in slightly different numbers from those published in the Home and Community Care Minimum Data Set 2003-04 Annual Bulletin. |
| (c) Not all HACC agencies submitted data to the HACC MDS. For 2003-04, the proportion of HACC-funded agencies that submitted HACC MDS data differed across jurisdictions (ranging from 77% to 99%). Actual client numbers will therefore be higher than those reported here. Because of this incomplete coverage, and because of cases with missing age and Indigenous status, numbers have been rounded to the nearest hundred. |
| AIHW analysis of Home and Community Care Program data |
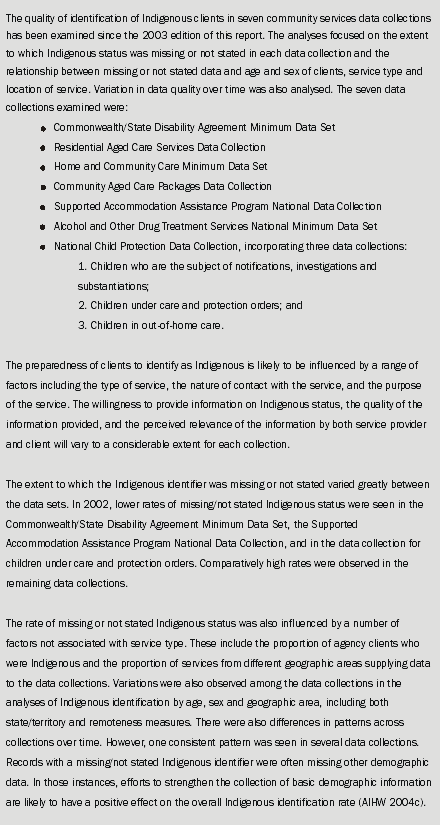
11.20 Indigenous identification in community services collections

 Print Page
 Print All