CHAPTER 4 – THE ORGANISING STRUCTURE FOR THE PRODUCER AND INTERNATIONAL TRADE PRICE INDEXES
BACKGROUND
4.1 An organising structure for the Producer and International Trade Price Indexes (PPIs and ITPIs) should provide a framework to draw together a range of detailed price series to enhance analysis. The current Producer Price Indexes (PPIs) and International Trade Price indexes (ITPIs) organising structure is the Stage of Production (SOP) framework, which is based on an economic categorisation of transactions according to their sequencing in the production chain. The SOP indexes are a rearrangement of the price series available from the component PPIs and ITPIs, and presented as an economy-wide framework. SOP indexes are output measures valued at basic prices.
4.2 Proposed by the ABS in 1997, the Analytical Framework for Price Indexes (the analytical framework) was an ABS initiative to overlay the Australian National Accounts Input-Output (I-O) tables with available ABS prices series to provide a coherent conceptual framework. This framework was developed specifically to support the study of inflation, where the SOP indexes present supply side inflation measures and the domestic final purchases (DFP) indexes were to present the demand side inflation measure.
4.3 The PPI and ITPI review will consider the value of the Analytical Framework for Price Indexes, assessing the SOP indexes for retention and DFP indexes for implementation.
4.4 Alternative organising structures will be evaluated, including a whole of economy input-output structure (as discussed in Chapter 3), which organises input and output indexes by product and industry. These indexes provide inflation measures for all products consumed by business, and all products available for use by an economy, respectively. The United States Bureau of Labor Statistics (BLS) PPI program's experimental aggregation system will also be investigated, which like the SOP framework, is based on an economic categorisation of transactions according to production chain sequencing.
ANALYTICAL FRAMEWORK FOR PRICE INDEXES
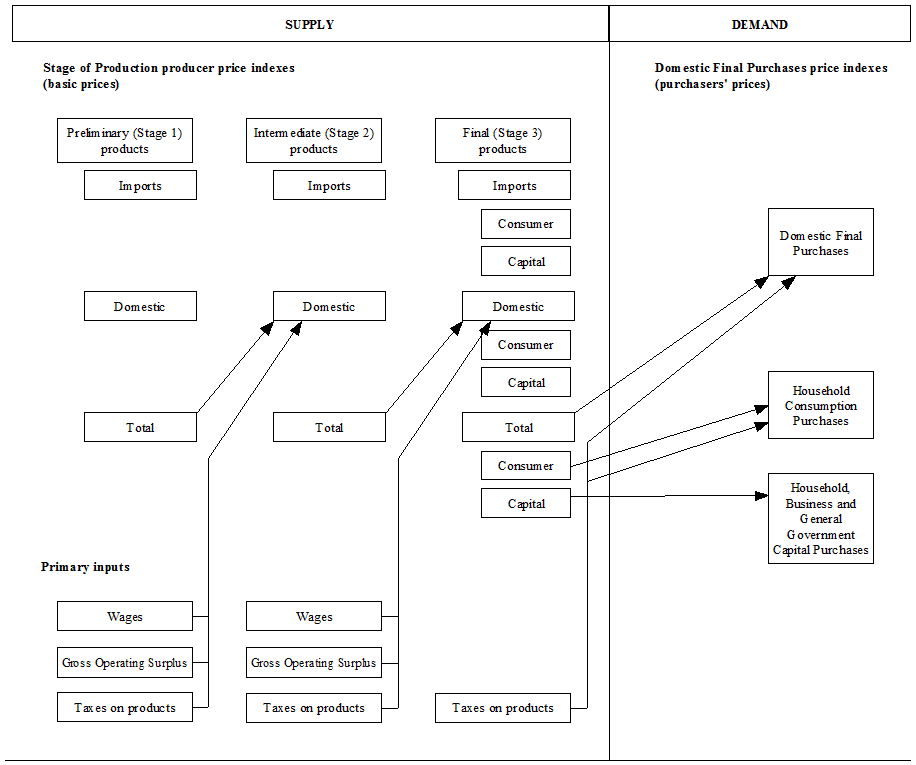
4.5 The analytical framework draws together price series to facilitate the interpretation of inflationary signals. The DFP indexes would provide a complementary demand side view of the economy as measured by indexes such as the supply side SOP PPIs.
4.6 The scope of the DFP framework reflects (final) purchases by Australian residents, including prices of imported items but excluding prices of exported items. Conceptually, the scope of the DFP indexes is most closely aligned with Domestic Final Demand (DFD) under the System of National Accounts (SNA) framework. DFP indexes would be available for consumption and capital purchases, split between the household, corporate (private and public), government and Non-profit institutions serving households sectors (ABS, 2001).
4.7 The scope and usefulness of the analytical framework is illustrated in Diagram 1, where sources and measurement points of inflationary pressures are shown.
Diagram 1: Relationship between Domestic Final Purchases and Stage of Production indexes

4.8 For further information on the analytical framework for price indexes please refer to the Information papers: Analytical Framework for Price Indexes in Australia (cat. no. 6421.0) and Price Index of Domestic Final Purchases (cat. no. 6428.0).
STAGE OF PRODUCTION FRAMEWORK
4.9 The SOP framework is a key component of the analytical framework and relates to the output of all the goods and services industries categorised according to their sequencing in the production chain.
4.10 The basis for the stage categorisation (and the weighting within each stage) is the I-O tables. The primary categorisation is between final products (i.e. products destined for final consumption, capital formation or export) and non-final products (i.e. products that flow into intermediate consumption for further processing).
4.11 To aid analysis, the non-final products flows are divided on a sequential basis between Stage 1 (or preliminary) products and Stage 2 (or intermediate) products. This approach generates three separate stages of production with each stage denoting proximity to the production of a final product.
4.12 Therefore, preliminary (Stage 1) products are used in the production of intermediate (Stage 2) products, and then intermediate (Stage 2) products flow into the production of final (Stage 3) products. In order to avoid multiple counting of transactions, the stages are not aggregated.
4.13 For each of the three stages, a summary measure is provided, while the detailed product indexes are categorised, by industry, into domestic production and imports. The final (Stage 3) summary is regarded as the PPI headline measure and its detailed product indexes can be further divided between capital, consumption and exports.
4.14 Diagram 2 below illustrates the stage of production concept. In the example, sugar cane as a Preliminary (Stage 1) product is an input into the production of raw sugar. In turn raw sugar is an Intermediate (Stage 2) product which is then used to produce the Final products refined sugar and beer (destined for final consumption or the export market). Diagram 2 also shows sugar cane, as an Intermediate (Stage 2) product, used to produce raw sugar which is then exported as a Final (Stage 3) product. For further information on the SOP indexes please refer to Appendix 2.
Diagram 2: Stage of Production framework – allocation of products by stage

Interpretation
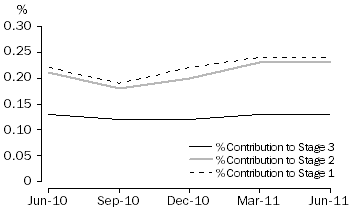
4.15 SOP indexes present the impact (or contribution) of a concurrent and simultaneous price change of a product primary to an industry on each of the three stages of production in the same reference period. For example raw sugar may drive a price rise within the Food Product Manufacturing subdivision of 3%, which will have different impacts of each stage of production depending on its weight within each SOP index. Graph 1 below illustrates the impact of price change and weighting within the three SOP indexes.
Graph 1: Contribution of the price change in Food Product Manufacturing to the SOP indexes

4.16 In the hypothetical June quarter 2011, a 3% rise in the products primary to the Food Product Manufacturing subdivision has contributed movements of 0.2% to the SOP Stage 1 index total percentage movement, 0.2% for SOP Stage 2 and 0.1% for SOP Stage 3.
4.17 While the SOP indexes themselves are not flow measures, the framework allows for analysis of price change as products flow through production processes. Price indexes for earlier stages of production may be indicators of future price changes for later stages. SOP indexes are intended to be indicators of upstream inflationary pressure and data users have highlighted their value for this purpose.
SOP coverage
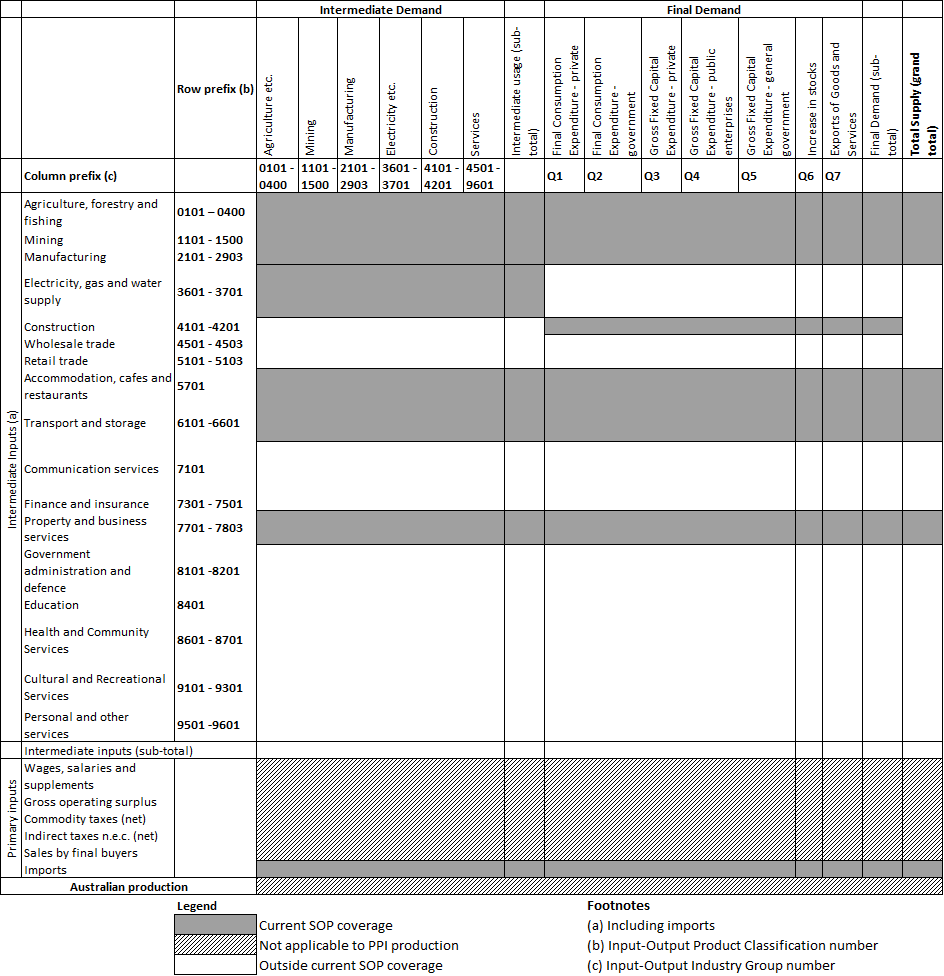
4.18 While conceptually an economy wide measure, for reasons of data availability, coverage of the SOP indexes is currently restricted to a broader range of goods than services. The shaded areas in Table 4 represent the I-O framework overlaid with the current SOP indexes coverage drawn from the suite of PPIs and ITPIs.
Table 4: Representation of SOP coverage using Input-Output framework at basic prices

4.19 If the SOP indexes are retained, the expansion of product coverage within the PPIs and ITPIs, as discussed in Chapter 3, will be reflected within the SOP indexes.
Weighting and classification issues
4.20 A review of the SOP indexes initially arose due to the Australian and New Zealand Industrial Classification 2006 (ANZSIC06) implementation and re-weight for the suite of PPIs. While the individual PPIs have been produced on an ANZSIC06 basis since September quarter 2009, the SOP indexes remained on the previous industrial classification edition (ANZSIC 1993) and the weighting patterns based on the 1994–95 I-O tables, pending the availability of appropriate weighting data.
ALTERNATIVE ORGANISING STRUCTURES
4.21 There are a range of alternative organising structures available for the aggregation of PPIs and ITPIs, two of which are discussed below. The research phase may reveal additional frameworks which will be investigated. The organisational structures will be examined for analytical power and fitness for purpose in the Australian economic context.
Whole of economy Input–Output organising structure
4.22 As discussed in detail in Chapter 3, a simple organising framework for the PPIs and ITPIs could present the input and output product indexes by industry, providing inflation measures representing all products consumed by business (input), and all products available for use by an economy (output), respectively.
4.23 This approach is currently used by Statistics New Zealand as the PPI organising structure. An organising structure of this type may be introduced in addition to, and not necessarily replace the SOP model, undertaking the presentation role currently performed by the current individual PPIs. As noted previously, there are some practical barriers to achieving a completely populated I-O organising structure.
Experimental PPI Aggregation System
4.24 The United States BLS PPI program recently developed an experimental aggregation system claimed to be more analytically useful than an all product index. It combines the product indexes into meaningful final-demand and intermediate-demand aggregates. The indexes convey information about the types of products contributing to inflation at both the final demand level and at earlier stages of production and can be used to track price change through the economy (BLS, 2011).
4.25 This aggregation system has very similar properties and aims to the Australian SOP framework although, whereas in the Australian SOP indexes, products may be allocated to any and all stages, products under the US experimental PPI aggregation system are confined to a single stage.
ABS POSITION
4.26 The analytical value of the SOP indexes will be evaluated in this review. Alternatives will be explored for use in the Australian context by evaluating the analytical power of each framework and fitness for purpose in the Australian economic context. This review will also assess DFP indexes for future implementation.
4.27 The ABS will re-weight and update the SOP indexes for the September quarter 2012, if the SOP framework continues as the organising structure.
USER COMMENTS
4.28 Users are invited to comment on:
- Whether the SOP framework is the most fit for purpose organising structure for the PPIs and ITPIs;
- If the SOP indexes are retained, whether the whole of economy I-O organising structure should be implemented in addition to SOP; and
- The usefulness of implementing the DFP indexes and continuing to develop and populate indexes as per the Analytical Framework for Price Indexes.
 Print Page
 Print All