CHAPTER 3 REGIONAL ASPECTS OF INTERNET AND BROADBAND ACCESS
Previous Australian studies based on Census 2001, as well as ABS surveys of Household access to Internet, such as the MPHS, have reported significant differences in spatial distribution of Internet use. This chapter uses the detailed regional information in the 2006 Census to analyse variations in Internet access between states and territories of Australia, between remoteness areas, and between urban and rural areas within states.
Chapter 4 provides analysis of access patterns based on more detailed analysis of data at the Statistical Local Area (SLA) and Collection District (CD) levels (including some maps). Detailed maps depicting patterns of access at finer geographic levels are available on the ABS website.
3.1. Internet access by State/Territory
The Australian Capital Territory has the highest proportion of occupied dwellings connected to the Internet (75%). New South Wales, Victoria, Queensland and Western Australia have similar levels of Internet connectivity, ranging between 63% and 65%. South Australia, Tasmania and the Northern Territory have similar levels of connectivity, ranging between 55% and 58%.
Similar patterns were also observed for Broadband connectivity. The Australian Capital Territory has the highest proportion of occupied dwellings having a Broadband connection (53%). New South Wales, Victoria, Queensland and Western Australia have very similar levels of Broadband connectivity, ranging between 41% and 42%. South Australia, Tasmania and the Northern Territory have similar levels of Broadband connectivity, ranging between 28% and 32%.
Since the 2001 Census, Internet connectivity has increased between 50% and 100% in all states and territories. Australian Capital Territory, with 75% (up from 49% in the 2001 Census) overall connectivity, still has the highest rate if Internet connectivity. Tasmania with 55% (up from 27% in the 2001 Census) has lowest connectivity, despite a doubling of estimated connectivity since the 2001 Census.
It should be noted that Census 2006 data are based on occupied private dwellings, which might be occupied by more than one household for a small minority of dwellings. MPHS data are based on a survey of selected households only. Census 2001 data for occupied private dwellings is derived on the basis of use at home. Most states and territories have a higher proportion of dwellings connected to the Internet on Census 2006 night compared to the 2005-06 reference period. The Northern Territory registered a drop in proportion of dwellings with Internet connectivity (57% as against 60%) which can be attributed to possible sampling error in MPHS. As regards Broadband connectivity, all states and territories registered large increases from the figures obtained from the MPHS results. The reverse is true for dial-up connections, which indicates a gradual shift to Broadband for Internet users. The 2005-06 MPHS results are an average over 2005-06, while the Census is at August 2006. 2005-06 being a period of significant Broadband rollout, Census 2006 figures are considerably higher than MPHS 2005-06.
Figure 1: Internet Access by Private Occupied Dwellings, by State/Territory - August 2006
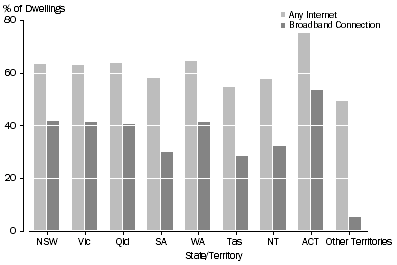
Table 1: Internet Access by State/Territory , Comparison Between Census 2001, MPHS 05-06 and Census 2006 |
|  |
| Internet Access | Broadband Access | |
| Census 01 | MPHS 05-06 | Census 06 | MPHS 05-06 | Census 06 | |
| % of
Dwellings | % of
Households | % of
Dwellings | % of
Households | % of
Dwellings | |
| |
| New South Wales | 36 | 60 | 63 | 28 | 42 | |
| Victoria | 36 | 59 | 63 | 30 | 42 | |
| Queensland | 34 | 61 | 64 | 30 | 41 | |
| South Australia | 32 | 56 | 58 | 20 | 30 | |
| West Australia | 36 | 62 | 65 | 30 | 41 | |
| Tasmania | 27 | 49 | 55 | 17 | 28 | |
| Northern Territory | 30 | 60 | 57 | 25 | 32 | |
| Australian Capital Territory | 49 | 72 | 75 | 40 | 53 | |
| Total | 35 | 60 | 63 | 28 | 40 | |
| |
.
3.2. Remoteness areas
The Remoteness Structure used in the ASGC describes Australia in terms of a measurement of remoteness. The Remoteness Structure includes all Collection Districts (CDs) and therefore in aggregate covers the whole of Australia. The purpose of the structure is to classify CDs which share common characteristics of remoteness into broad geographical areas called Remoteness areas (RAs).
At the time of preparation of this report, correspondence between Census 2006 data and the latest RAs were not available. Therefore the RAs were determined based on the 2001 boundaries. Minor shifts in remoteness boundaries will not have any significant impact on the results of this study.
Results from the 2006 Census show that dwellings in Major Cities of Australia continue to have significantly higher Internet access compared to other regions, and this difference is more pronounced for access to Broadband.
There is considerable difference in dwelling access rates between Major Cities of Australia and regional areas. At the national level, 66% of dwellings in major cities have access to the Internet, compared to 42% for Very Remote Australia. This gap is even more pronounced for Broadband access, the corresponding figures being 46% and 24%, respectively.
There is very little difference in access rates between Outer Regional Australia and Remote Australia at the national level. However, differences in access rates for different remoteness classes by state are greater for Broadband. For example, only 10% of private occupied dwellings in very remote Tasmania have Broadband access in comparison with 28% in very remote NSW. The corresponding figures for Internet are 42% for Very Remote Queensland against 49% for Very Remote areas of Northern Territory and Tasmania. A similar pattern is observed for other remoteness classes as well. South Australia registered the lowest level of Broadband connectivity for major cities (33%), Inner Regional Areas (23%) and Outer Regional Areas (19%).
The MPHS 2005-06 estimated similar patterns for in-scope RAs (very remote areas being out of scope for MPHS). That is, connectivity is still significantly lower than major cities for all other remoteness classifications.
The comparison reveals that in comparison with Major Cities, overall connectivity for all other RAs have increased at greater rates, having at least doubled between the two Censuses. This has resulted in narrowing, in proportion terms, of the connectivity gap. Likewise, estimated increases in Broadband connectivity from MPHS 2005-06 for all remoteness areas (which have been at least 50% higher than the MPHS 05-06 levels) have been higher than that of major cities , which increased from 33% to 46%.
Figure 2: Internet Access by Private Occupied Dwellings by Remoteness - August 2006
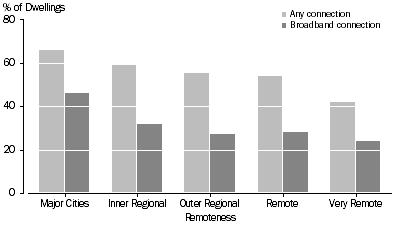
Table 2: Internet Access by Remoteness Area, Comparison Between Census 2001, MPHS 05-06 and Census 2006 |
| |
| Internet Access | Broadband Access | |
| Census 01 | MPHS 05-06 | Census 06 | MPHS 05-06 | Census 06 | |
| % of
Dwellings | % of
Households | % of
Dwellings | % of
Households | % of
Dwellings | |
| |
| Major Cities of Australia | 39 | 62 | 66 | 33 | 46 | |
| Inner Regional Australia | 29 | 56 | 59 | 21 | 32 | |
| Outer Regional Australia | 26 | 52 | 55 | 16 | 27 | |
| Remote Australia | 25 | 53 | 54 | 19 | 28 | |
| Very Remote Australia | 17 | - | 42 | - | 24 | |
| Total | 35 | 60 | 63 | 28 | 40 | |
| |
| - nil or rounded to zero (including null cells) |
3.3. Section of State Structure
The Section of State (SOS) Structure is another geographic classification in the ASGC. Defined only in census years, the SOS Structure uses population counts ( the Remoteness Area Structure uses a remoteness measure to classify CDs) from the latest Census to classify CDs as urban or rural. The SOS structure includes all CDs and therefore, in aggregate, covers all of Australia. The categories are:
- Major Urban - Population ranges 100,000 or more
- Other Urban - Population ranges from 1,000 to 99,999
- Bounded locality - Population ranges from 200 to 999
- Rural Balance - the remainder of the state/territory
- Migratory - areas composed of off-shore, shipping and migratory CDs
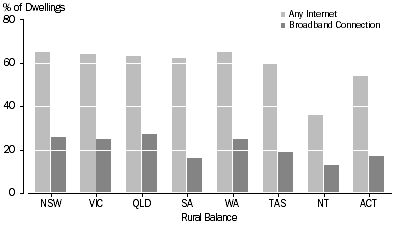
Figures 3, 4 and 5 show the proportions of dwellings with or without Internet access by the SOS Structure. Major Urban and Other Urban areas have been combined into a single "Urban" category. Urban areas registered significantly higher overall connectivity than bounded localities, but overall connectivity in rural balance areas are similar to urban areas. With Broadband connectivity, urban areas registered significantly higher rates in comparison with other areas. However, Broadband connectivity across bounded localities and rural balance areas are similar.
Figure 3: Internet Access by Private Occupied Dwellings, in Urban Areas in each State/Territory - August 2006
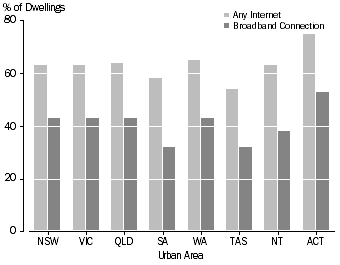 Figure4: Internet Access by Private Occupied Dwellings,
 in Bounded Localities in each State/Territory - August 2006
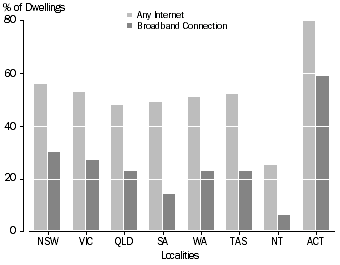 Figure 5: Internet Access by Private Dwellings in Rural Balance -
 August 2006
 Print Page
 Print All