SOUTH AUSTRALIA
Homes owned with a mortgage
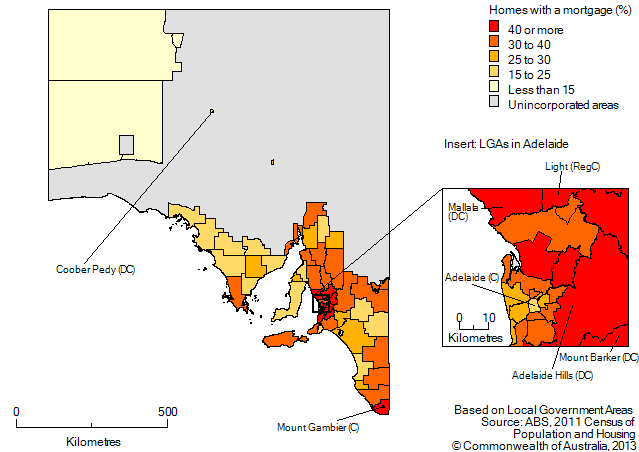
- In 2011, the proportion of homes owned with a mortgage in South Australia was 35.3%, compared with 34.9% for Australia.
- The Local Government Area (LGA) with the highest proportion of homes owned with a mortgage was Mallala with 54.4%. Other LGAs with high proportions of 45% of more were Light (50.8%), Adelaide Hills (46.3%), and Mount Barker (45.8%).
- The LGAs with high proportions of homes owned with a mortgage were located on the fringe or outer areas of the major cities of Adelaide and Mount Gambier.
- Coober Pedy and the inner city LGA of Adelaide were among the areas with the lowest proportions of homes owned with a mortgage, with 17.9% and 17.1% respectively.
HOMES OWNED WITH A MORTGAGE(a), by Local Government Area, South Australia, 2011
 (a) The number of occupied private dwellings which were owned with a mortgage or being purchased under a rent/buy scheme
by a member of the household, expressed as a proportion of total occupied private dwellings.
Excludes 'Visitor only' and 'Other non-classifiable' households.
Median monthly mortgage repayments over time
- In South Australia, the LGA with the fastest growth in median monthly mortgage repayments between 2006 and 2011 was Roxby Downs in the far north of the state, with an increase of 78.7%.
- The LGA with the fastest growth in mortgage costs in Greater Adelaide was Charles Sturt, in the west of the city, which rose by 53.6%.
- The LGAs with the fastest growth in mortgage costs for the rest of South Australia were mainly located the north-west of the state. Also Southern Mallee, south-east of the state.
FASTEST GROWTH IN MEDIAN MONTHLY MORTGAGE REPAYMENTS(a), by Local Government Area(b), South Australia, 2006 and 2011
|
| Local Government Area | Median Mortgage Repayment | Change |
|
2006
($/month) | 2011
($/month) | ($) | (%) |
|
| Greater Adelaide |
| Charles Sturt | 1 100 | 1 690 | 590 | 53.6 |
| Playford | 867 | 1 300 | 433 | 49.9 |
| Campbelltown | 1 083 | 1 600 | 517 | 47.7 |
| Port Adelaide Enfield | 1 083 | 1 599 | 516 | 47.6 |
| Onkaparinga | 1 000 | 1 473 | 473 | 47.3 |
| Rest of South Australia |
| Roxby Downs | 1 300 | 2 323 | 1 023 | 78.7 |
| Whyalla | 737 | 1 300 | 563 | 76.4 |
| Port Augusta | 693 | 1 200 | 507 | 73.2 |
| Mount Remarkable | 542 | 921 | 379 | 69.9 |
| Southern Mallee | 477 | 780 | 303 | 63.5 |
|
| (a) Applicable to occupied private dwellings which were owned with a mortgage or being purchased under a rent/buy scheme by a member of the household. Excludes 'Visitor only' and 'Other non-classifiable' households. |
| (b) LGAs with a total occupied private dwelling count under 500 dwellings in 2011 are excluded from this table. |
| Cells in this table have been randomly adjusted to avoid the release of confidential data. |
| Source: ABS Census of Population and Housing, 2006 and 2011. |
 Print Page
 Print All