| Feb 20 | Mar 20 | Monthly change | Yearly change | ||
|---|---|---|---|---|---|
| Trend | |||||
| Employed people | 13,003,700 | 13,020,500 | 16,800 | 1.8% | |
| Unemployed people | 709,800 | 713,300 | 3,500 | 4.0% | |
| Unemployment rate | 5.2% | 5.2% | 0.0 pts | 0.1 pts | |
| Underemployment rate | 8.6% | 8.7% | 0.1 pts | 0.4 pts | |
| Participation rate | 66.0% | 66.0% | 0.0 pts | 0.2 pts | |
| Monthly hours worked in all jobs | 1,781 million | 1,782 million | 0 million | 0.8% | |
| Seasonally adjusted | |||||
| Employed people | 13,011,700 | 13,017,600 | 5,900 | 1.8% | |
| Unemployed people | 698,400 | 718,600 | 20,300 | 4.8% | |
| Unemployment rate | 5.1% | 5.2% | 0.1 pts | 0.1 pts | |
| Underemployment rate | 8.7% | 8.8% | 0.1 pts | 0.6 pts | |
| Participation rate | 66.0% | 66.0% | 0.0 pts | 0.3 pts | |
| Monthly hours worked in all jobs | 1,776 million | 1,785 million | 9 million | 0.7% |
Labour Force, Australia
This is not the latest release View the latest release
Headline estimates of employment, unemployment, underemployment, participation and hours worked from the monthly Labour Force Survey
Reference period
March 2020
Released
16/04/2020
Key statistics
Trend estimates for March 2020:
- Unemployment rate remained at 5.2%.
- Participation rate remained at 66.0%.
- Employment increased to 13,020,500.
- Employment to population ratio remained at 62.6%.
- Underemployment rate increased to 8.7%.
- Monthly hours worked increased to 1,782 million hours.
Managing the impact of Coronavirus (COVID-19) on labour force statistics
The ABS is currently monitoring for potential impacts from the coronavirus (COVID-19) on Labour Force statistics and will continue to do so for the duration of the pandemic.
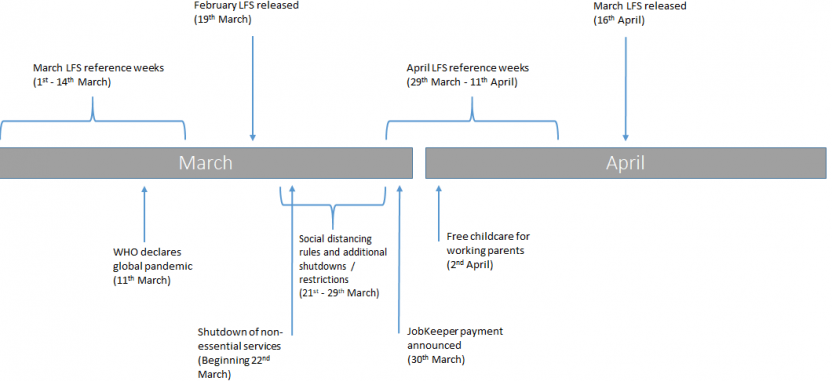
Quality assurance of March data did not identify any major impact to headline statistics, with only some small early impacts evident, particularly in hours worked. It is important to note that the reference period for March was 1-14 March, which was before a global pandemic was declared and before the major actions in Australia to contain the spread of the virus.
As with other major disruption to the economy, early impacts are usually most evident in the monthly hours worked in all jobs series (Data downloads Table 19). Additional information, such as the reason people worked fewer hours than usual, is available within Labour Force, Australia, Detailed, due for release on 23 April. Some of the aggregate information, in original terms, from the detailed release has been published in an article in this release, to assist in analysis of March Labour Force data. This information can be found in Insights into hours worked. Some caution needs to be exercised when using original data at more disaggregated levels, as they are subject to larger sampling variability and seasonal patterns.
Additional supporting information can also be found in Classifying people during the COVID-19 period and People moving into or out of employment or unemployment every month.
The ABS will also be actively managing the potential risks from COVID-19 to data collection operations. Around 90% of responses to the Labour Force Survey are usually provided through telephone interviews or online, leaving around 10% involving face-to-face interviews.
While the ABS suspended face-to-face interviews during the last week of March 2020 enumeration, there was no notable impact on survey collection operations or the quality of March data, with response to the survey at a similar level to previous months. The ABS acknowledges the continued support of Australians in responding to our surveys during such a difficult time, given how critically important this information is.
Additionally, travel restrictions have meant that ABS interviewers have not been able to collect Labour Force data from some remote and very remote Indigenous communities. To ensure that the contribution from these communities remains represented within Labour Force statistics, the ABS has imputed some information. It is expected that the ABS will continue with this approach for the duration of the pandemic.
Impacts of Coronavirus (COVID-19) on trend estimation and seasonal adjustment in the Labour Force Survey
Time series and sudden changes in the labour market
Trend and seasonally adjusted Labour Force Survey estimates are important for understanding the current state of the labour market, and providing medium and long-term signals.
However, unusual, sudden and/or extreme changes in the labour market (e.g. changes to regular and seasonal patterns in employment, working hours, job search or availability as a result of COVID-19) can be difficult to account for in the short-term in both seasonal adjustment and trend estimation processes.
The ABS has been monitoring the impacts from COVID-19 on labour force time series, and considering what changes may be required in future months to ensure they continue to provide a meaningful indicator of current labour market activity.
Trend and seasonally adjusted estimates for March
The trend and seasonally adjusted estimates for March have not been impacted as a result of COVID-19, and they continue to provide a robust measure of the labour market.
This is primarily due to the reference weeks falling in the first half of March, when there was a relatively low number of confirmed COVID-19 cases within Australia, and many of the additional social distancing measures, shutdowns of non-essential services and trading restrictions had either not yet been announced or taken effect.
Changes in trend and seasonal adjustment series from April
The ABS expects that there will be considerable month-to-month changes in Labour Force time series estimates from April onwards, which may necessitate changes to both trend and seasonally adjusted series.
It is likely that the seasonal adjustment process for some series will need to move to a methodology better suited to large movements at the end point (for example, the use of a forward (seasonal) factors method). Any changes made will be done so as to ensure that if there are large changes in the data, these will not have a disproportionate influence on the seasonal factors, as would be the case if the standard method of concurrent seasonal factors continued to be used.
The ABS will also consider whether to temporarily suspend trend estimates from April 2020 data (which will be released in May), until more certainty emerges in the underlying trend in labour market activity over the COVID-19 pandemic period. While trend estimates are generally the best measure of the underlying behaviour of the labour market, any large changes in the labour market as a result of COVID-19 will likely make it difficult to estimate a reliable short-term indicator of the trend.
Once further data are available, trend and/or seasonal breaks may be estimated and applied to improve published labour force time series estimates. The ABS will also provide regular updates on the status of trend and seasonally adjusted estimates.
Any change in approach for labour force statistics will be broadly consistent with the approach being taken across the range of other ABS time series.
For a more detailed discussion on the implications of unusual events on time series, see When it's not "business-as-usual": Implications for ABS Time Series.
Further information
For further information on the impact of COVID-19 on labour force time series, or on labour force statistics more generally, please email labour.statistics@abs.gov.au.
Additional labour market data to be published during COVID-19 pandemic
From 23 March, Australia has seen the progressive introduction of major social distancing and other business-related restrictions to slow the spread of COVID-19. In response to this, the ABS introduced the Business Impacts of COVID-19 Survey, with the most recent data released on 7 April. In addition, two new statistical products – the Household Impacts of COVID-19 Survey and Weekly Payroll Jobs and Wages in Australia – will be released on 20 April and 21 April.
Further information on these products and other regular products can be found in ‘Measuring the labour market impacts of COVID-19’, as part of a suite of additional COVID-19 related measures at www.abs.gov.au/covid19.
Managing the impact of the bushfires on labour force statistics
Major bushfires resulted in disruption to ABS data collection operations in some regions in New South Wales and Victoria during January 2020, and to a lesser extent in February 2020. A few remaining areas in New South Wales, particularly within the ‘Capital Region’, were still unable to be surveyed in March 2020.
The ABS has resumed publishing the full suite of estimates for the bushfire affected regions. Caution should be exercised in comparing estimates for these regions for January 2020 and February 2020 with estimates before and after these months, and in comparing these estimates with those for other regions.
All data are trend unless otherwise stated. The trend series smooths the more volatile seasonally adjusted estimates and provides the best measure of the underlying behaviour of the labour market.
Estimates of changes are calculated using un-rounded level estimates, and may be different from, but are more accurate than, movements obtained from the rounded level estimates.
Unemployment
In March 2020:
- the unemployment rate remained steady at 5.2% (0.1 pts higher than a year ago)
- unemployed people decreased by 3,500 to 713,300 (and increased by 27,300 over the year to March 2020)
- the youth unemployment rate (i.e. for those aged 15-24) remained steady at 11.8% (and increased 0.1 pts over the year to March 2020)
In seasonally adjusted terms, in March 2020:
- the unemployment rate increased by 0.1 pts to 5.2% (0.1 pts higher than a year ago)
- unemployed people increased by 20,300 to 718,600 (and increased by 33,200 over the year to March 2020)
the youth unemployment rate decreased by 0.5 pts to 11.6% (and decreased by 0.2 pts over the year to March 2020)
| Trend (%) | Seasonally adjusted (%) | |
|---|---|---|
| Mar-10 | 5.4 | 5.4 |
| Apr-10 | 5.3 | 5.5 |
| May-10 | 5.3 | 5.2 |
| Jun-10 | 5.2 | 5.1 |
| Jul-10 | 5.2 | 5.3 |
| Aug-10 | 5.2 | 5.0 |
| Sep-10 | 5.1 | 5.1 |
| Oct-10 | 5.1 | 5.3 |
| Nov-10 | 5.1 | 5.1 |
| Dec-10 | 5.0 | 4.9 |
| Jan-11 | 5.0 | 5.0 |
| Feb-11 | 5.0 | 5.0 |
| Mar-11 | 5.0 | 4.9 |
| Apr-11 | 5.0 | 5.0 |
| May-11 | 5.0 | 5.0 |
| Jun-11 | 5.0 | 4.9 |
| Jul-11 | 5.1 | 5.1 |
| Aug-11 | 5.2 | 5.3 |
| Sep-11 | 5.2 | 5.2 |
| Oct-11 | 5.3 | 5.2 |
| Nov-11 | 5.3 | 5.2 |
| Dec-11 | 5.2 | 5.2 |
| Jan-12 | 5.2 | 5.0 |
| Feb-12 | 5.2 | 5.2 |
| Mar-12 | 5.1 | 5.2 |
| Apr-12 | 5.1 | 5.0 |
| May-12 | 5.2 | 5.2 |
| Jun-12 | 5.2 | 5.2 |
| Jul-12 | 5.2 | 5.2 |
| Aug-12 | 5.3 | 5.1 |
| Sep-12 | 5.3 | 5.5 |
| Oct-12 | 5.3 | 5.4 |
| Nov-12 | 5.4 | 5.3 |
| Dec-12 | 5.4 | 5.4 |
| Jan-13 | 5.4 | 5.4 |
| Feb-13 | 5.5 | 5.4 |
| Mar-13 | 5.6 | 5.6 |
| Apr-13 | 5.6 | 5.6 |
| May-13 | 5.6 | 5.6 |
| Jun-13 | 5.7 | 5.7 |
| Jul-13 | 5.7 | 5.6 |
| Aug-13 | 5.7 | 5.8 |
| Sep-13 | 5.8 | 5.7 |
| Oct-13 | 5.8 | 5.8 |
| Nov-13 | 5.8 | 5.8 |
| Dec-13 | 5.9 | 5.9 |
| Jan-14 | 5.9 | 5.9 |
| Feb-14 | 5.8 | 5.9 |
| Mar-14 | 5.8 | 5.9 |
| Apr-14 | 5.9 | 5.8 |
| May-14 | 5.9 | 5.9 |
| Jun-14 | 6.0 | 6.0 |
| Jul-14 | 6.1 | 6.2 |
| Aug-14 | 6.2 | 6.1 |
| Sep-14 | 6.2 | 6.2 |
| Oct-14 | 6.3 | 6.4 |
| Nov-14 | 6.3 | 6.3 |
| Dec-14 | 6.3 | 6.1 |
| Jan-15 | 6.2 | 6.3 |
| Feb-15 | 6.2 | 6.1 |
| Mar-15 | 6.1 | 6.1 |
| Apr-15 | 6.1 | 6.1 |
| May-15 | 6.1 | 5.9 |
| Jun-15 | 6.1 | 6.0 |
| Jul-15 | 6.1 | 6.3 |
| Aug-15 | 6.0 | 6.1 |
| Sep-15 | 6.0 | 6.2 |
| Oct-15 | 5.9 | 5.9 |
| Nov-15 | 5.9 | 5.9 |
| Dec-15 | 5.8 | 5.7 |
| Jan-16 | 5.8 | 6.0 |
| Feb-16 | 5.7 | 5.7 |
| Mar-16 | 5.7 | 5.6 |
| Apr-16 | 5.7 | 5.6 |
| May-16 | 5.7 | 5.7 |
| Jun-16 | 5.6 | 5.7 |
| Jul-16 | 5.6 | 5.7 |
| Aug-16 | 5.6 | 5.6 |
| Sep-16 | 5.6 | 5.6 |
| Oct-16 | 5.7 | 5.6 |
| Nov-16 | 5.7 | 5.8 |
| Dec-16 | 5.8 | 5.8 |
| Jan-17 | 5.8 | 5.7 |
| Feb-17 | 5.8 | 5.8 |
| Mar-17 | 5.8 | 5.8 |
| Apr-17 | 5.7 | 5.6 |
| May-17 | 5.7 | 5.5 |
| Jun-17 | 5.6 | 5.6 |
| Jul-17 | 5.5 | 5.6 |
| Aug-17 | 5.5 | 5.5 |
| Sep-17 | 5.5 | 5.4 |
| Oct-17 | 5.5 | 5.4 |
| Nov-17 | 5.5 | 5.4 |
| Dec-17 | 5.5 | 5.6 |
| Jan-18 | 5.5 | 5.5 |
| Feb-18 | 5.5 | 5.6 |
| Mar-18 | 5.5 | 5.5 |
| Apr-18 | 5.5 | 5.5 |
| May-18 | 5.4 | 5.4 |
| Jun-18 | 5.4 | 5.3 |
| Jul-18 | 5.3 | 5.3 |
| Aug-18 | 5.2 | 5.3 |
| Sep-18 | 5.1 | 5.0 |
| Oct-18 | 5.1 | 5.0 |
| Nov-18 | 5.0 | 5.1 |
| Dec-18 | 5.0 | 5.0 |
| Jan-19 | 5.0 | 5.1 |
| Feb-19 | 5.0 | 5.0 |
| Mar-19 | 5.1 | 5.1 |
| Apr-19 | 5.1 | 5.2 |
| May-19 | 5.2 | 5.2 |
| Jun-19 | 5.2 | 5.3 |
| Jul-19 | 5.2 | 5.2 |
| Aug-19 | 5.3 | 5.3 |
| Sep-19 | 5.2 | 5.2 |
| Oct-19 | 5.2 | 5.3 |
| Nov-19 | 5.2 | 5.2 |
| Dec-19 | 5.1 | 5.1 |
| Jan-20 | 5.1 | 5.3 |
| Feb-20 | 5.1 | 5.1 |
| Mar-20 | 5.2 | 5.2 |
Unemployment rate
["","Trend","Seasonally adjusted"]
[["Mar-10","Apr-10","May-10","Jun-10","Jul-10","Aug-10","Sep-10","Oct-10","Nov-10","Dec-10","Jan-11","Feb-11","Mar-11","Apr-11","May-11","Jun-11","Jul-11","Aug-11","Sep-11","Oct-11","Nov-11","Dec-11","Jan-12","Feb-12","Mar-12","Apr-12","May-12","Jun-12","Jul-12","Aug-12","Sep-12","Oct-12","Nov-12","Dec-12","Jan-13","Feb-13","Mar-13","Apr-13","May-13","Jun-13","Jul-13","Aug-13","Sep-13","Oct-13","Nov-13","Dec-13","Jan-14","Feb-14","Mar-14","Apr-14","May-14","Jun-14","Jul-14","Aug-14","Sep-14","Oct-14","Nov-14","Dec-14","Jan-15","Feb-15","Mar-15","Apr-15","May-15","Jun-15","Jul-15","Aug-15","Sep-15","Oct-15","Nov-15","Dec-15","Jan-16","Feb-16","Mar-16","Apr-16","May-16","Jun-16","Jul-16","Aug-16","Sep-16","Oct-16","Nov-16","Dec-16","Jan-17","Feb-17","Mar-17","Apr-17","May-17","Jun-17","Jul-17","Aug-17","Sep-17","Oct-17","Nov-17","Dec-17","Jan-18","Feb-18","Mar-18","Apr-18","May-18","Jun-18","Jul-18","Aug-18","Sep-18","Oct-18","Nov-18","Dec-18","Jan-19","Feb-19","Mar-19","Apr-19","May-19","Jun-19","Jul-19","Aug-19","Sep-19","Oct-19","Nov-19","Dec-19","Jan-20","Feb-20","Mar-20"],[[5.3728692000000002],[5.3309550000000003],[5.2818962000000003],[5.2334259999999997],[5.1904395000000001],[5.1527782000000002],[5.1230598000000001],[5.0980160000000003],[5.0711576000000003],[5.0410602999999998],[5.0133438999999997],[4.9902987000000003],[4.9765186000000003],[4.9821565999999997],[5.0066345999999999],[5.0470870000000003],[5.1071230999999999],[5.1752886],[5.2303135000000003],[5.2602795000000002],[5.2588717000000003],[5.2284566999999997],[5.1876794000000004],[5.1544796000000002],[5.1384150999999996],[5.1438512000000003],[5.1711416000000003],[5.2090268999999996],[5.2475803000000001],[5.2817641000000002],[5.3091213000000002],[5.3299608999999997],[5.3554322000000001],[5.3942528000000003],[5.4440628999999996],[5.4996698999999998],[5.5583083000000002],[5.6081969999999997],[5.6451720999999999],[5.6710890000000003],[5.6962023999999998],[5.7255437999999996],[5.7640751999999997],[5.8062779999999998],[5.8392929000000002],[5.8545382999999998],[5.8524177000000002],[5.8445761999999997],[5.8456514999999998],[5.8668031999999997],[5.9194838000000001],[5.9994183000000003],[6.0907724999999999],[6.1753758000000003],[6.2413862],[6.2779791999999999],[6.2856734000000003],[6.2669679],[6.2278567000000002],[6.1791700000000001],[6.1343801999999998],[6.1054067999999999],[6.0900926999999996],[6.0812191999999996],[6.0681058999999999],[6.0430020999999998],[6.0009360000000003],[5.9455492000000003],[5.8808797999999998],[5.8163004999999997],[5.7621808000000003],[5.7210421],[5.6915414000000002],[5.6727233000000004],[5.6568914000000001],[5.6421907999999998],[5.6333792000000003],[5.6341561999999996],[5.6450887999999999],[5.6756878000000004],[5.7226808],[5.7689937000000002],[5.7931650000000001],[5.7890537999999996],[5.7573232000000001],[5.7077653000000002],[5.6510195000000003],[5.5939483000000001],[5.5398212999999998],[5.4973741],[5.4723898999999996],[5.4598687999999997],[5.4595652000000001],[5.4743826999999996],[5.4937163],[5.5035097000000004],[5.4948199999999998],[5.4662487999999998],[5.4189537000000003],[5.3599772999999997],[5.2915437000000001],[5.2174011],[5.1461208000000003],[5.0848462999999997],[5.0413636999999998],[5.0189607000000001],[5.0220200000000004],[5.0482288000000004],[5.0894586000000004],[5.1361654999999997],[5.1830793999999996],[5.2240098000000001],[5.2497705000000003],[5.2566518999999996],[5.2443058999999996],[5.2167159999999999],[5.1800467000000001],[5.1425644999999998],[5.1148518000000003],[5.0982086000000004],[5.193988]],[[5.4232123000000003],[5.5004873999999999],[5.2302270000000002],[5.1455479000000004],[5.2859704000000001],[5.0205083000000004],[5.0532016999999998],[5.2857975000000001],[5.1085091],[4.8771532000000004],[5.0029101999999996],[4.9870139],[4.9257226000000003],[4.9605313999999998],[5.0141439999999999],[4.9174354999999998],[5.0886468999999996],[5.2549318999999999],[5.2209367999999996],[5.1892543],[5.2295809999999996],[5.1969114999999997],[5.0456801000000002],[5.2155180999999997],[5.1807736000000002],[4.9946276999999997],[5.2015997],[5.1638593000000004],[5.1756494999999996],[5.1419107000000004],[5.4875179999999997],[5.4134010000000004],[5.2549232000000003],[5.4331126000000003],[5.3857745000000001],[5.4290713000000004],[5.6353263],[5.5876504999999996],[5.6112780999999998],[5.6968437999999999],[5.6247721999999998],[5.8198433999999999],[5.7034691000000004],[5.8266669000000002],[5.7959398000000002],[5.9014948],[5.9341837999999996],[5.9022619000000001],[5.8687474999999996],[5.8043369],[5.9304259999999998],[6.0492635999999997],[6.1675899000000003],[6.0832138000000002],[6.2219486000000002],[6.3648208000000004],[6.2991545000000002],[6.1067901000000004],[6.3383599999999998],[6.1190445000000002],[6.0936766000000002],[6.1121736000000002],[5.9311081000000003],[6.0085670000000002],[6.2649540999999997],[6.0820730999999997],[6.1556053999999998],[5.9187152999999997],[5.8570260000000003],[5.7460183999999996],[6.0244172999999996],[5.6719454000000002],[5.6457192000000003],[5.6445283000000002],[5.7195019],[5.6936055999999997],[5.6820545999999998],[5.6036099000000004],[5.6358870999999997],[5.5830375999999999],[5.7664514999999996],[5.8341944000000003],[5.6857604999999998],[5.8372786999999997],[5.8464752999999998],[5.6165351000000001],[5.5407611000000001],[5.5969107999999999],[5.5771325999999997],[5.5090941999999998],[5.4355691000000004],[5.3646948999999999],[5.4245600999999999],[5.6113498000000002],[5.5080252999999999],[5.5574187000000004],[5.5098029000000004],[5.5391089999999998],[5.3916167000000002],[5.3178543999999999],[5.2706004000000002],[5.2627208000000003],[5.0015086000000002],[4.9994795999999999],[5.1107743000000001],[5.0101497999999998],[5.0511920999999997],[4.9578362],[5.0853070000000002],[5.2221016999999996],[5.2081340999999997],[5.2527780000000002],[5.2478157999999997],[5.2569498000000001],[5.1870202000000001],[5.3020680999999996],[5.1713396999999999],[5.0626290000000003],[5.2900374000000001],[5.0973116999999997],[5.2314996999999996]]]
[]
[{"axis_id":"0","tick_interval":"12","axis_min":"","axis_max":"","axis_title":"","precision":-1,"axis_units":"","tooltip_units":"","table_units":"","data_unit_prefix":"","data_unit_suffix":"","reverse_axis":false}][{"axis_id":"0","tick_interval":"0.2","axis_min":"4.8","axis_max":"6.4","axis_title":"%","precision":"1","table_units":"(%)","tooltip_units":"(%)","axis_units":"","data_unit_prefix":"","data_unit_suffix":"","reverse_axis":false}]Employment
In March 2020:
- employment increased by 0.13% or 16,800 people to 13,020,500, which was lower than the 20 year average monthly growth rate of 0.16%
- over the year to March 2020, employment increased by 1.8% or 224,100 people, which was lower than the 20 year annual average growth rate of 2.0%
In seasonally adjusted terms, in March 2020:
- employment increased by 5,900 to 13,017,600 people
- over the year to March 2020, employment increased by 1.8% or 227,000 people
Underpinning these net changes in employment is extensive change which occurs in the labour market. In recent months there has generally been considerably more than 300,000 people entering employment, and more than 300,000 leaving employment each month. There are also changes in the hours that people work, which can have an impact on the full-time and part-time composition of employment.
| Trend ('000) | Seasonally adjusted ('000) | |
|---|---|---|
| Mar-10 | 10,931.9 | 10,925.2 |
| Apr-10 | 10,942.9 | 10,937.1 |
| May-10 | 10,957.7 | 10,938.5 |
| Jun-10 | 10,979.9 | 10,992.7 |
| Jul-10 | 11,010.4 | 11,019.0 |
| Aug-10 | 11,046.2 | 11,060.0 |
| Sep-10 | 11,082.3 | 11,088.1 |
| Oct-10 | 11,114.7 | 11,104.3 |
| Nov-10 | 11,140.5 | 11,162.6 |
| Dec-10 | 11,159.1 | 11,168.4 |
| Jan-11 | 11,171.7 | 11,199.3 |
| Feb-11 | 11,179.8 | 11,174.4 |
| Mar-11 | 11,185.8 | 11,214.9 |
| Apr-11 | 11,191.1 | 11,182.3 |
| May-11 | 11,197.8 | 11,172.2 |
| Jun-11 | 11,206.4 | 11,206.0 |
| Jul-11 | 11,216.0 | 11,209.8 |
| Aug-11 | 11,226.6 | 11,216.8 |
| Sep-11 | 11,237.2 | 11,247.3 |
| Oct-11 | 11,246.9 | 11,249.2 |
| Nov-11 | 11,254.8 | 11,252.2 |
| Dec-11 | 11,262.5 | 11,230.8 |
| Jan-12 | 11,272.0 | 11,304.6 |
| Feb-12 | 11,285.1 | 11,269.4 |
| Mar-12 | 11,301.7 | 11,333.1 |
| Apr-12 | 11,319.3 | 11,322.1 |
| May-12 | 11,335.0 | 11,363.9 |
| Jun-12 | 11,347.4 | 11,339.6 |
| Jul-12 | 11,356.1 | 11,348.9 |
| Aug-12 | 11,362.6 | 11,357.0 |
| Sep-12 | 11,370.2 | 11,391.9 |
| Oct-12 | 11,380.5 | 11,391.3 |
| Nov-12 | 11,393.4 | 11,384.8 |
| Dec-12 | 11,407.9 | 11,395.7 |
| Jan-13 | 11,422.3 | 11,462.6 |
| Feb-13 | 11,435.9 | 11,465.5 |
| Mar-13 | 11,447.1 | 11,434.7 |
| Apr-13 | 11,455.7 | 11,467.9 |
| May-13 | 11,462.1 | 11,458.0 |
| Jun-13 | 11,466.4 | 11,471.8 |
| Jul-13 | 11,468.8 | 11,457.8 |
| Aug-13 | 11,468.1 | 11,454.1 |
| Sep-13 | 11,463.8 | 11,476.7 |
| Oct-13 | 11,458.0 | 11,471.1 |
| Nov-13 | 11,454.1 | 11,448.7 |
| Dec-13 | 11,455.4 | 11,418.1 |
| Jan-14 | 11,464.0 | 11,454.6 |
| Feb-14 | 11,479.3 | 11,477.3 |
| Mar-14 | 11,498.7 | 11,531.5 |
| Apr-14 | 11,517.3 | 11,538.8 |
| May-14 | 11,531.1 | 11,514.3 |
| Jun-14 | 11,539.1 | 11,531.0 |
| Jul-14 | 11,543.7 | 11,546.1 |
| Aug-14 | 11,547.4 | 11,545.9 |
| Sep-14 | 11,553.6 | 11,547.5 |
| Oct-14 | 11,564.3 | 11,543.0 |
| Nov-14 | 11,579.6 | 11,545.1 |
| Dec-14 | 11,599.4 | 11,597.4 |
| Jan-15 | 11,622.9 | 11,607.0 |
| Feb-15 | 11,648.3 | 11,677.5 |
| Mar-15 | 11,673.6 | 11,692.8 |
| Apr-15 | 11,696.7 | 11,693.6 |
| May-15 | 11,717.5 | 11,735.7 |
| Jun-15 | 11,738.0 | 11,730.0 |
| Jul-15 | 11,760.6 | 11,761.7 |
| Aug-15 | 11,787.6 | 11,773.3 |
| Sep-15 | 11,818.9 | 11,784.4 |
| Oct-15 | 11,851.0 | 11,861.2 |
| Nov-15 | 11,881.5 | 11,897.6 |
| Dec-15 | 11,906.7 | 11,905.7 |
| Jan-16 | 11,924.1 | 11,909.1 |
| Feb-16 | 11,935.8 | 11,930.5 |
| Mar-16 | 11,944.5 | 11,940.5 |
| Apr-16 | 11,953.0 | 11,949.2 |
| May-16 | 11,961.7 | 11,945.5 |
| Jun-16 | 11,969.7 | 11,966.0 |
| Jul-16 | 11,977.0 | 11,997.7 |
| Aug-16 | 11,984.1 | 11,973.0 |
| Sep-16 | 11,990.8 | 11,954.2 |
| Oct-16 | 11,998.8 | 11,986.2 |
| Nov-16 | 12,009.7 | 12,014.4 |
| Dec-16 | 12,025.2 | 12,036.5 |
| Jan-17 | 12,047.8 | 12,053.5 |
| Feb-17 | 12,077.2 | 12,061.4 |
| Mar-17 | 12,112.8 | 12,116.3 |
| Apr-17 | 12,153.2 | 12,170.1 |
| May-17 | 12,194.7 | 12,196.5 |
| Jun-17 | 12,234.3 | 12,227.8 |
| Jul-17 | 12,270.9 | 12,261.7 |
| Aug-17 | 12,305.0 | 12,313.0 |
| Sep-17 | 12,338.6 | 12,343.7 |
| Oct-17 | 12,372.4 | 12,355.8 |
| Nov-17 | 12,405.6 | 12,412.1 |
| Dec-17 | 12,435.8 | 12,452.2 |
| Jan-18 | 12,460.1 | 12,483.3 |
| Feb-18 | 12,477.7 | 12,484.1 |
| Mar-18 | 12,491.7 | 12,489.0 |
| Apr-18 | 12,505.4 | 12,507.4 |
| May-18 | 12,522.8 | 12,507.4 |
| Jun-18 | 12,546.2 | 12,576.8 |
| Jul-18 | 12,574.0 | 12,575.3 |
| Aug-18 | 12,604.2 | 12,615.8 |
| Sep-18 | 12,634.6 | 12,627.7 |
| Oct-18 | 12,663.4 | 12,665.7 |
| Nov-18 | 12,689.6 | 12,700.0 |
| Dec-18 | 12,715.2 | 12,723.1 |
| Jan-19 | 12,741.7 | 12,751.5 |
| Feb-19 | 12,768.9 | 12,758.9 |
| Mar-19 | 12,796.4 | 12,781.9 |
| Apr-19 | 12,823.9 | 12,815.8 |
| May-19 | 12,850.5 | 12,854.5 |
| Jun-19 | 12,874.3 | 12,856.8 |
| Jul-19 | 12,894.1 | 12,886.7 |
| Aug-19 | 12,910.1 | 12,923.2 |
| Sep-19 | 12,923.5 | 12,934.8 |
| Oct-19 | 12,936.7 | 12,910.6 |
| Nov-19 | 12,951.7 | 12,946.3 |
| Dec-19 | 12,969.4 | 12,975.5 |
| Jan-20 | 12,989.0 | 12,988.4 |
| Feb-20 | 13,010.2 | 13,015.1 |
| Mar-20 | 13,020.5 | 13,017.6 |
Employed persons
["","Trend","Seasonally adjusted"]
[["Mar-10","Apr-10","May-10","Jun-10","Jul-10","Aug-10","Sep-10","Oct-10","Nov-10","Dec-10","Jan-11","Feb-11","Mar-11","Apr-11","May-11","Jun-11","Jul-11","Aug-11","Sep-11","Oct-11","Nov-11","Dec-11","Jan-12","Feb-12","Mar-12","Apr-12","May-12","Jun-12","Jul-12","Aug-12","Sep-12","Oct-12","Nov-12","Dec-12","Jan-13","Feb-13","Mar-13","Apr-13","May-13","Jun-13","Jul-13","Aug-13","Sep-13","Oct-13","Nov-13","Dec-13","Jan-14","Feb-14","Mar-14","Apr-14","May-14","Jun-14","Jul-14","Aug-14","Sep-14","Oct-14","Nov-14","Dec-14","Jan-15","Feb-15","Mar-15","Apr-15","May-15","Jun-15","Jul-15","Aug-15","Sep-15","Oct-15","Nov-15","Dec-15","Jan-16","Feb-16","Mar-16","Apr-16","May-16","Jun-16","Jul-16","Aug-16","Sep-16","Oct-16","Nov-16","Dec-16","Jan-17","Feb-17","Mar-17","Apr-17","May-17","Jun-17","Jul-17","Aug-17","Sep-17","Oct-17","Nov-17","Dec-17","Jan-18","Feb-18","Mar-18","Apr-18","May-18","Jun-18","Jul-18","Aug-18","Sep-18","Oct-18","Nov-18","Dec-18","Jan-19","Feb-19","Mar-19","Apr-19","May-19","Jun-19","Jul-19","Aug-19","Sep-19","Oct-19","Nov-19","Dec-19","Jan-20","Feb-20","Mar-20"],[[10931.897999999999],[10942.893819999999],[10957.656779999999],[10979.89718],[11010.417939999999],[11046.212079999999],[11082.251200000001],[11114.66136],[11140.53753],[11159.14696],[11171.66872],[11179.80292],[11185.83783],[11191.08755],[11197.84648],[11206.446910000001],[11215.95865],[11226.628489999999],[11237.229719999999],[11246.940699999999],[11254.76519],[11262.45242],[11271.96564],[11285.060509999999],[11301.70325],[11319.29141],[11335.04279],[11347.428819999999],[11356.063120000001],[11362.564990000001],[11370.152550000001],[11380.475399999999],[11393.397430000001],[11407.93295],[11422.28787],[11435.879919999999],[11447.12206],[11455.716410000001],[11462.086380000001],[11466.396839999999],[11468.77723],[11468.051460000001],[11463.822840000001],[11457.97041],[11454.143319999999],[11455.432339999999],[11464.005359999999],[11479.27054],[11498.67064],[11517.334150000001],[11531.086789999999],[11539.076779999999],[11543.691269999999],[11547.3896],[11553.58453],[11564.29336],[11579.57977],[11599.3842],[11622.874900000001],[11648.349910000001],[11673.63234],[11696.688249999999],[11717.46247],[11737.971310000001],[11760.61548],[11787.64284],[11818.85644],[11850.973840000001],[11881.51239],[11906.670760000001],[11924.062169999999],[11935.84562],[11944.46744],[11952.95155],[11961.721890000001],[11969.72875],[11977.022360000001],[11984.106540000001],[11990.81134],[11998.76636],[12009.68348],[12025.18399],[12047.78788],[12077.2353],[12112.76931],[12153.175869999999],[12194.67798],[12234.312400000001],[12270.8542],[12304.967000000001],[12338.59737],[12372.418439999999],[12405.597519999999],[12435.757240000001],[12460.092119999999],[12477.71335],[12491.657590000001],[12505.4038],[12522.80501],[12546.19815],[12573.9746],[12604.21112],[12634.62025],[12663.36414],[12689.625019999999],[12715.20565],[12741.65177],[12768.85253],[12796.359490000001],[12823.871150000001],[12850.481330000001],[12874.26478],[12894.081630000001],[12910.1404],[12923.4743],[12936.692419999999],[12951.74452],[12969.399509999999],[12989.04074],[13010.163],[13020.457850000001]],[[10925.226290000001],[10937.06014],[10938.525750000001],[10992.70011],[11018.990299999999],[11060.04809],[11088.094870000001],[11104.31286],[11162.575720000001],[11168.351839999999],[11199.25345],[11174.37988],[11214.88859],[11182.347959999999],[11172.20032],[11206.02456],[11209.7549],[11216.82503],[11247.338830000001],[11249.23408],[11252.175800000001],[11230.77376],[11304.60125],[11269.416279999999],[11333.12112],[11322.119119999999],[11363.86982],[11339.57432],[11348.886490000001],[11357.033530000001],[11391.870709999999],[11391.2845],[11384.795829999999],[11395.699189999999],[11462.610619999999],[11465.53894],[11434.72755],[11467.92613],[11458.00762],[11471.79261],[11457.80092],[11454.120849999999],[11476.74675],[11471.05521],[11448.731460000001],[11418.0597],[11454.609549999999],[11477.30416],[11531.48806],[11538.81633],[11514.320250000001],[11531.037270000001],[11546.12896],[11545.90789],[11547.48481],[11542.97682],[11545.133739999999],[11597.4406],[11606.99317],[11677.501329999999],[11692.77961],[11693.618399999999],[11735.713610000001],[11729.998740000001],[11761.65733],[11773.303809999999],[11784.36673],[11861.19317],[11897.630499999999],[11905.72667],[11909.05912],[11930.528689999999],[11940.49432],[11949.1837],[11945.5437],[11965.97544],[11997.744909999999],[11973.00073],[11954.218779999999],[11986.24611],[12014.43273],[12036.450639999999],[12053.49098],[12061.386399999999],[12116.345310000001],[12170.084290000001],[12196.47215],[12227.840749999999],[12261.679630000001],[12313.04566],[12343.680249999999],[12355.78529],[12412.116099999999],[12452.20282],[12483.325059999999],[12484.06911],[12489.028609999999],[12507.387220000001],[12507.36017],[12576.77756],[12575.3174],[12615.7744],[12627.69327],[12665.693670000001],[12699.990089999999],[12723.080620000001],[12751.47258],[12758.865470000001],[12781.90645],[12815.822099999999],[12854.53817],[12856.75792],[12886.747810000001],[12923.173349999999],[12934.779780000001],[12910.6284],[12946.29869],[12975.527],[12988.407719999999],[13015.120989999999],[13017.609039999999]]]
[]
[{"axis_id":"0","tick_interval":"12","axis_min":"","axis_max":"","axis_title":"","precision":-1,"axis_units":"","tooltip_units":"","table_units":"","data_unit_prefix":"","data_unit_suffix":"","reverse_axis":false}][{"axis_id":"0","tick_interval":"200","axis_min":"10500","axis_max":"13100","axis_title":"('000)","precision":"1","table_units":"('000)","tooltip_units":"('000)","axis_units":"","data_unit_prefix":"","data_unit_suffix":"","reverse_axis":false}]Full-time and part-time employment
In March 2020:
- full-time employment increased by 8,800 to 8,888,900 people, and part-time employment increased 8,000 to 4,131,550 people
- over the year to March 2020, full-time employment increased by 116,000 people and part-time employment increased by 108,100 people
This has led to an increase in the part-time share of employment from 31.4% to 31.7% over the year to March 2020.
In seasonally adjusted terms, in March 2020:
- full-time employment decreased by 400 to 8,877,440, and part-time employment increased 6,400 to 4,135,560
- over the year to March 2020, full-time employment increased by 91,700 people and part-time employment increased by 136,000 people
Employment to population ratio
In March 2020:
- the employment to population ratio remained steady at 62.6%, and increased 0.1 pts from the same time last year
In seasonally adjusted terms, in March 2020:
- the employment to population ratio decreased by 0.1 pts to 62.5%, and increased by 0.1 pts from the same time last year
The employment to population ratio provides a measure of the change in employment relative to changes in the size of the population.
| Trend (%) | Seasonally adjusted (%) | |
|---|---|---|
| Mar-10 | 61.7 | 61.7 |
| Apr-10 | 61.7 | 61.7 |
| May-10 | 61.7 | 61.6 |
| Jun-10 | 61.8 | 61.9 |
| Jul-10 | 61.9 | 61.9 |
| Aug-10 | 62.0 | 62.1 |
| Sep-10 | 62.1 | 62.2 |
| Oct-10 | 62.2 | 62.2 |
| Nov-10 | 62.3 | 62.4 |
| Dec-10 | 62.3 | 62.4 |
| Jan-11 | 62.3 | 62.5 |
| Feb-11 | 62.3 | 62.2 |
| Mar-11 | 62.2 | 62.4 |
| Apr-11 | 62.2 | 62.1 |
| May-11 | 62.1 | 62.0 |
| Jun-11 | 62.1 | 62.1 |
| Jul-11 | 62.1 | 62.0 |
| Aug-11 | 62.1 | 62.0 |
| Sep-11 | 62.0 | 62.1 |
| Oct-11 | 62.0 | 62.0 |
| Nov-11 | 61.9 | 61.9 |
| Dec-11 | 61.9 | 61.7 |
| Jan-12 | 61.8 | 62.0 |
| Feb-12 | 61.8 | 61.7 |
| Mar-12 | 61.8 | 62.0 |
| Apr-12 | 61.8 | 61.8 |
| May-12 | 61.8 | 61.9 |
| Jun-12 | 61.8 | 61.7 |
| Jul-12 | 61.7 | 61.7 |
| Aug-12 | 61.7 | 61.6 |
| Sep-12 | 61.6 | 61.7 |
| Oct-12 | 61.6 | 61.7 |
| Nov-12 | 61.6 | 61.5 |
| Dec-12 | 61.6 | 61.5 |
| Jan-13 | 61.5 | 61.8 |
| Feb-13 | 61.5 | 61.7 |
| Mar-13 | 61.5 | 61.4 |
| Apr-13 | 61.4 | 61.5 |
| May-13 | 61.4 | 61.4 |
| Jun-13 | 61.3 | 61.4 |
| Jul-13 | 61.3 | 61.2 |
| Aug-13 | 61.2 | 61.1 |
| Sep-13 | 61.1 | 61.2 |
| Oct-13 | 61.0 | 61.1 |
| Nov-13 | 60.9 | 60.9 |
| Dec-13 | 60.8 | 60.7 |
| Jan-14 | 60.8 | 60.7 |
| Feb-14 | 60.8 | 60.8 |
| Mar-14 | 60.8 | 60.9 |
| Apr-14 | 60.8 | 60.9 |
| May-14 | 60.8 | 60.7 |
| Jun-14 | 60.8 | 60.8 |
| Jul-14 | 60.8 | 60.8 |
| Aug-14 | 60.7 | 60.7 |
| Sep-14 | 60.7 | 60.6 |
| Oct-14 | 60.7 | 60.5 |
| Nov-14 | 60.7 | 60.5 |
| Dec-14 | 60.7 | 60.7 |
| Jan-15 | 60.7 | 60.6 |
| Feb-15 | 60.8 | 60.9 |
| Mar-15 | 60.8 | 60.9 |
| Apr-15 | 60.9 | 60.8 |
| May-15 | 60.9 | 61.0 |
| Jun-15 | 60.9 | 60.9 |
| Jul-15 | 61.0 | 61.0 |
| Aug-15 | 61.1 | 61.0 |
| Sep-15 | 61.2 | 61.0 |
| Oct-15 | 61.3 | 61.3 |
| Nov-15 | 61.3 | 61.4 |
| Dec-15 | 61.4 | 61.4 |
| Jan-16 | 61.4 | 61.3 |
| Feb-16 | 61.4 | 61.3 |
| Mar-16 | 61.3 | 61.3 |
| Apr-16 | 61.3 | 61.2 |
| May-16 | 61.2 | 61.2 |
| Jun-16 | 61.2 | 61.2 |
| Jul-16 | 61.1 | 61.3 |
| Aug-16 | 61.1 | 61.0 |
| Sep-16 | 61.1 | 60.9 |
| Oct-16 | 61.0 | 60.9 |
| Nov-16 | 61.0 | 61.0 |
| Dec-16 | 61.0 | 61.0 |
| Jan-17 | 61.0 | 61.0 |
| Feb-17 | 61.0 | 60.9 |
| Mar-17 | 61.1 | 61.1 |
| Apr-17 | 61.2 | 61.3 |
| May-17 | 61.3 | 61.4 |
| Jun-17 | 61.5 | 61.4 |
| Jul-17 | 61.6 | 61.5 |
| Aug-17 | 61.7 | 61.7 |
| Sep-17 | 61.8 | 61.8 |
| Oct-17 | 61.9 | 61.8 |
| Nov-17 | 61.9 | 62.0 |
| Dec-17 | 62.0 | 62.1 |
| Jan-18 | 62.0 | 62.2 |
| Feb-18 | 62.0 | 62.0 |
| Mar-18 | 62.0 | 62.0 |
| Apr-18 | 62.0 | 62.0 |
| May-18 | 62.0 | 61.9 |
| Jun-18 | 62.0 | 62.2 |
| Jul-18 | 62.1 | 62.1 |
| Aug-18 | 62.1 | 62.2 |
| Sep-18 | 62.2 | 62.1 |
| Oct-18 | 62.2 | 62.2 |
| Nov-18 | 62.3 | 62.3 |
| Dec-18 | 62.3 | 62.4 |
| Jan-19 | 62.4 | 62.4 |
| Feb-19 | 62.4 | 62.3 |
| Mar-19 | 62.4 | 62.3 |
| Apr-19 | 62.5 | 62.4 |
| May-19 | 62.5 | 62.6 |
| Jun-19 | 62.6 | 62.5 |
| Jul-19 | 62.6 | 62.6 |
| Aug-19 | 62.6 | 62.7 |
| Sep-19 | 62.6 | 62.6 |
| Oct-19 | 62.6 | 62.5 |
| Nov-19 | 62.6 | 62.6 |
| Dec-19 | 62.6 | 62.7 |
| Jan-20 | 62.6 | 62.6 |
| Feb-20 | 62.6 | 62.6 |
| Mar-20 | 62.6 | 62.5 |
Employment to population ratio
["","Trend","Seasonally adjusted"]
[["Mar-10","Apr-10","May-10","Jun-10","Jul-10","Aug-10","Sep-10","Oct-10","Nov-10","Dec-10","Jan-11","Feb-11","Mar-11","Apr-11","May-11","Jun-11","Jul-11","Aug-11","Sep-11","Oct-11","Nov-11","Dec-11","Jan-12","Feb-12","Mar-12","Apr-12","May-12","Jun-12","Jul-12","Aug-12","Sep-12","Oct-12","Nov-12","Dec-12","Jan-13","Feb-13","Mar-13","Apr-13","May-13","Jun-13","Jul-13","Aug-13","Sep-13","Oct-13","Nov-13","Dec-13","Jan-14","Feb-14","Mar-14","Apr-14","May-14","Jun-14","Jul-14","Aug-14","Sep-14","Oct-14","Nov-14","Dec-14","Jan-15","Feb-15","Mar-15","Apr-15","May-15","Jun-15","Jul-15","Aug-15","Sep-15","Oct-15","Nov-15","Dec-15","Jan-16","Feb-16","Mar-16","Apr-16","May-16","Jun-16","Jul-16","Aug-16","Sep-16","Oct-16","Nov-16","Dec-16","Jan-17","Feb-17","Mar-17","Apr-17","May-17","Jun-17","Jul-17","Aug-17","Sep-17","Oct-17","Nov-17","Dec-17","Jan-18","Feb-18","Mar-18","Apr-18","May-18","Jun-18","Jul-18","Aug-18","Sep-18","Oct-18","Nov-18","Dec-18","Jan-19","Feb-19","Mar-19","Apr-19","May-19","Jun-19","Jul-19","Aug-19","Sep-19","Oct-19","Nov-19","Dec-19","Jan-20","Feb-20","Mar-20"],[[61.731520500000002],[61.711641200000003],[61.719180199999997],[61.773229700000002],[61.875541599999998],[62.0067795],[62.1376572],[62.245056599999998],[62.311548700000003],[62.332240599999999],[62.314967899999999],[62.271957999999998],[62.219331199999999],[62.166539899999997],[62.1265541],[62.0992289],[62.076596899999998],[62.057335299999998],[62.033298299999998],[61.998644400000003],[61.947430099999998],[61.889563500000001],[61.838013199999999],[61.805546800000002],[61.795212200000002],[61.794575600000002],[61.788567800000003],[61.767314800000001],[61.727117],[61.675540400000003],[61.6298733],[61.598004699999997],[61.578031299999999],[61.563540199999998],[61.545571000000002],[61.523118799999999],[61.490178],[61.446944500000001],[61.396075400000001],[61.337858099999998],[61.2723917],[61.193100299999998],[61.0974626],[60.993520699999998],[60.8978903],[60.824437000000003],[60.785188099999999],[60.780075600000004],[60.7996263],[60.820895899999996],[60.8220867],[60.796492700000002],[60.753967199999998],[60.705600599999997],[60.6687382],[60.653240099999998],[60.6583872],[60.682937199999998],[60.723405700000001],[60.773503499999997],[60.825238900000002],[60.870145899999997],[60.907915500000001],[60.946911],[60.9974214],[61.069524299999998],[61.161521800000003],[61.254951900000002],[61.335190500000003],[61.381255600000003],[61.382159600000001],[61.352379599999999],[61.3083119],[61.267370900000003],[61.2311312],[61.191766600000001],[61.1476428],[61.100686400000001],[61.050691800000003],[61.005322499999998],[60.971680300000003],[60.9563256],[60.972669099999997],[61.022335400000003],[61.105626999999998],[61.219168500000002],[61.344140600000003],[61.463645300000003],[61.569632400000003],[61.6644553],[61.757833099999999],[61.851459900000002],[61.938244099999999],[62.003234399999997],[62.032414199999998],[62.024375399999997],[61.998656699999998],[61.975566800000003],[61.974512099999998],[62.005070199999999],[62.057481699999997],[62.121776500000003],[62.187344600000003],[62.244593799999997],[62.2876671],[62.323284299999997],[62.359547599999999],[62.399087399999999],[62.444079600000002],[62.4956447],[62.548888499999997],[62.591549899999997],[62.615451100000001],[62.620333799999997],[62.610180700000001],[62.597977700000001],[62.593578899999997],[62.599711900000003],[62.613210600000002],[62.632462400000001],[62.568066199999997]],[[61.675788099999998],[61.674342000000003],[61.614489900000002],[61.851346900000003],[61.925873899999999],[62.083129700000001],[62.167055400000002],[62.184753999999998],[62.437591300000001],[62.396593099999997],[62.473919299999999],[62.240347300000003],[62.371105399999998],[62.1152832],[61.984307399999999],[62.0973197],[62.043346800000002],[62.004980699999997],[62.096135199999999],[62.012697000000003],[61.935263999999997],[61.724278099999999],[62.019761899999999],[61.717199899999997],[61.956312199999999],[61.808917100000002],[61.949508700000003],[61.730177400000002],[61.690043000000003],[61.643705699999998],[61.742157300000002],[61.6542648],[61.534706999999997],[61.509354999999999],[61.767899100000001],[61.6813693],[61.413922100000001],[61.512051599999999],[61.378946999999997],[61.373006199999999],[61.2151876],[61.112819100000003],[61.150885100000004],[61.058631599999998],[60.878117400000001],[60.653629500000001],[60.744981899999999],[60.762683899999999],[60.946748499999998],[60.926017999999999],[60.737459299999998],[60.766449799999997],[60.770951699999998],[60.694955399999998],[60.628576600000002],[60.537928100000002],[60.482386300000002],[60.689411200000002],[60.645642500000001],[60.920018900000002],[60.905854300000001],[60.848969199999999],[61.006667899999997],[60.915764699999997],[61.005769399999998],[60.991900800000003],[60.975030599999997],[61.3038174],[61.423353599999999],[61.396470600000001],[61.310438400000002],[61.317931199999997],[61.266353500000001],[61.241443799999999],[61.1534719],[61.188791500000001],[61.258015100000001],[61.038919399999997],[60.850837300000002],[60.936351299999998],[61.002153700000001],[61.036501700000002],[61.008803399999998],[60.935010499999997],[61.098815000000002],[61.298121500000001],[61.359355700000002],[61.445481800000003],[61.527179599999997],[61.697850899999999],[61.764304500000001],[61.761546699999997],[61.979641299999997],[62.116252199999998],[62.158004499999997],[62.048609200000001],[61.960534199999998],[61.977806399999999],[61.904042500000003],[62.173751600000003],[62.069037799999997],[62.171215799999999],[62.132662799999999],[62.248867599999997],[62.346631299999999],[62.389217899999998],[62.416326300000001],[62.340743799999998],[62.341743399999999],[62.446922800000003],[62.575264799999999],[62.525871600000002],[62.5855836],[62.676344100000001],[62.646650200000003],[62.467701499999997],[62.578265999999999],[62.657504199999998],[62.607320799999997],[62.623877],[62.524019600000003]]]
[]
[{"axis_id":"0","tick_interval":"12","axis_min":"","axis_max":"","axis_title":"","precision":-1,"axis_units":"","tooltip_units":"","table_units":"","data_unit_prefix":"","data_unit_suffix":"","reverse_axis":false}][{"axis_id":"0","tick_interval":"0.5","axis_min":"60.0","axis_max":"63.0","axis_title":"%","precision":"1","table_units":"(%)","tooltip_units":"(%)","axis_units":"","data_unit_prefix":"","data_unit_suffix":"","reverse_axis":false}]Hours worked
In March 2020, monthly hours worked in all jobs:
- increased by less than 1 million hours (0.0%) to 1,782 million hours
- increased by 0.8% over the year, which is below the 1.8% increase in employed people
In seasonally adjusted terms, in March 2020, monthly hours worked in all jobs:
- increased by 9 million hours (0.5%) to 1,785 million hours
- increased by 0.7% over the year, which is below the 1.8% increase in employed people
| Trend (m) | Seasonally adjusted (m) | |
|---|---|---|
| Mar-10 | 1,537.6 | 1,525.4 |
| Apr-10 | 1,541.0 | 1,537.7 |
| May-10 | 1,545.3 | 1,554.2 |
| Jun-10 | 1,550.4 | 1,554.0 |
| Jul-10 | 1,555.6 | 1,548.4 |
| Aug-10 | 1,560.5 | 1,562.9 |
| Sep-10 | 1,565.1 | 1,562.1 |
| Oct-10 | 1,569.6 | 1,566.8 |
| Nov-10 | 1,573.8 | 1,571.4 |
| Dec-10 | 1,577.0 | 1,569.4 |
| Jan-11 | 1,578.6 | 1,582.0 |
| Feb-11 | 1,578.7 | 1,579.9 |
| Mar-11 | 1,578.1 | 1,579.1 |
| Apr-11 | 1,577.3 | 1,554.9 |
| May-11 | 1,577.4 | 1,573.5 |
| Jun-11 | 1,578.7 | 1,582.0 |
| Jul-11 | 1,580.6 | 1,582.9 |
| Aug-11 | 1,582.5 | 1,584.1 |
| Sep-11 | 1,583.8 | 1,581.3 |
| Oct-11 | 1,584.5 | 1,590.7 |
| Nov-11 | 1,585.1 | 1,585.9 |
| Dec-11 | 1,586.7 | 1,587.1 |
| Jan-12 | 1,589.4 | 1,589.5 |
| Feb-12 | 1,592.2 | 1,586.3 |
| Mar-12 | 1,594.2 | 1,595.4 |
| Apr-12 | 1,594.9 | 1,599.6 |
| May-12 | 1,594.1 | 1,604.5 |
| Jun-12 | 1,592.1 | 1,578.3 |
| Jul-12 | 1,590.4 | 1,588.9 |
| Aug-12 | 1,589.8 | 1,587.8 |
| Sep-12 | 1,590.9 | 1,598.6 |
| Oct-12 | 1,593.5 | 1,583.4 |
| Nov-12 | 1,596.3 | 1,600.4 |
| Dec-12 | 1,598.7 | 1,602.9 |
| Jan-13 | 1,600.2 | 1,601.4 |
| Feb-13 | 1,601.3 | 1,603.3 |
| Mar-13 | 1,602.5 | 1,596.9 |
| Apr-13 | 1,604.2 | 1,613.1 |
| May-13 | 1,606.4 | 1,604.8 |
| Jun-13 | 1,608.9 | 1,604.9 |
| Jul-13 | 1,610.4 | 1,615.2 |
| Aug-13 | 1,610.3 | 1,619.2 |
| Sep-13 | 1,609.1 | 1,607.4 |
| Oct-13 | 1,607.5 | 1,606.7 |
| Nov-13 | 1,606.3 | 1,603.4 |
| Dec-13 | 1,605.6 | 1,604.3 |
| Jan-14 | 1,605.5 | 1,597.9 |
| Feb-14 | 1,606.3 | 1,606.0 |
| Mar-14 | 1,607.8 | 1,613.4 |
| Apr-14 | 1,609.7 | 1,602.5 |
| May-14 | 1,611.8 | 1,610.1 |
| Jun-14 | 1,613.5 | 1,617.0 |
| Jul-14 | 1,614.3 | 1,615.2 |
| Aug-14 | 1,614.3 | 1,615.3 |
| Sep-14 | 1,613.8 | 1,611.0 |
| Oct-14 | 1,614.0 | 1,611.6 |
| Nov-14 | 1,615.7 | 1,612.5 |
| Dec-14 | 1,619.3 | 1,600.0 |
| Jan-15 | 1,623.8 | 1,629.4 |
| Feb-15 | 1,628.1 | 1,627.3 |
| Mar-15 | 1,631.2 | 1,635.9 |
| Apr-15 | 1,633.0 | 1,638.7 |
| May-15 | 1,634.3 | 1,635.2 |
| Jun-15 | 1,636.0 | 1,632.9 |
| Jul-15 | 1,638.6 | 1,639.4 |
| Aug-15 | 1,642.0 | 1,637.1 |
| Sep-15 | 1,646.0 | 1,648.6 |
| Oct-15 | 1,650.3 | 1,653.0 |
| Nov-15 | 1,653.9 | 1,654.1 |
| Dec-15 | 1,656.2 | 1,650.9 |
| Jan-16 | 1,657.0 | 1,661.3 |
| Feb-16 | 1,656.7 | 1,663.5 |
| Mar-16 | 1,656.1 | 1,653.9 |
| Apr-16 | 1,655.7 | 1,633.8 |
| May-16 | 1,655.7 | 1,662.9 |
| Jun-16 | 1,656.4 | 1,655.8 |
| Jul-16 | 1,657.9 | 1,660.8 |
| Aug-16 | 1,660.3 | 1,663.1 |
| Sep-16 | 1,662.7 | 1,659.2 |
| Oct-16 | 1,665.1 | 1,665.0 |
| Nov-16 | 1,667.4 | 1,666.9 |
| Dec-16 | 1,669.5 | 1,673.5 |
| Jan-17 | 1,671.5 | 1,694.4 |
| Feb-17 | 1,674.2 | 1,662.7 |
| Mar-17 | 1,677.8 | 1,676.7 |
| Apr-17 | 1,682.6 | 1,665.8 |
| May-17 | 1,688.3 | 1,710.6 |
| Jun-17 | 1,694.3 | 1,705.2 |
| Jul-17 | 1,700.6 | 1,697.8 |
| Aug-17 | 1,706.4 | 1,703.2 |
| Sep-17 | 1,711.6 | 1,711.1 |
| Oct-17 | 1,715.9 | 1,714.9 |
| Nov-17 | 1,719.3 | 1,727.8 |
| Dec-17 | 1,721.4 | 1,720.8 |
| Jan-18 | 1,722.4 | 1,700.4 |
| Feb-18 | 1,723.0 | 1,723.7 |
| Mar-18 | 1,724.4 | 1,723.9 |
| Apr-18 | 1,727.0 | 1,745.8 |
| May-18 | 1,730.7 | 1,729.3 |
| Jun-18 | 1,735.1 | 1,738.7 |
| Jul-18 | 1,739.4 | 1,740.6 |
| Aug-18 | 1,743.4 | 1,741.6 |
| Sep-18 | 1,746.8 | 1,746.8 |
| Oct-18 | 1,750.1 | 1,753.3 |
| Nov-18 | 1,753.8 | 1,751.4 |
| Dec-18 | 1,758.1 | 1,749.7 |
| Jan-19 | 1,762.3 | 1,763.2 |
| Feb-19 | 1,765.6 | 1,765.8 |
| Mar-19 | 1,767.7 | 1,774.2 |
| Apr-19 | 1,769.0 | 1,772.2 |
| May-19 | 1,769.9 | 1,766.3 |
| Jun-19 | 1,770.9 | 1,765.8 |
| Jul-19 | 1,772.7 | 1,773.6 |
| Aug-19 | 1,775.3 | 1,777.3 |
| Sep-19 | 1,778.0 | 1,781.0 |
| Oct-19 | 1,779.8 | 1,777.1 |
| Nov-19 | 1,780.5 | 1,779.6 |
| Dec-19 | 1,780.5 | 1,787.3 |
| Jan-20 | 1,780.0 | 1,778.4 |
| Feb-20 | 1,779.3 | 1,775.4 |
| Mar-20 | 1,781.7 | 1,784.9 |
Monthly hours worked in all jobs
["","Trend","Seasonally adjusted"]
[["Mar-10","Apr-10","May-10","Jun-10","Jul-10","Aug-10","Sep-10","Oct-10","Nov-10","Dec-10","Jan-11","Feb-11","Mar-11","Apr-11","May-11","Jun-11","Jul-11","Aug-11","Sep-11","Oct-11","Nov-11","Dec-11","Jan-12","Feb-12","Mar-12","Apr-12","May-12","Jun-12","Jul-12","Aug-12","Sep-12","Oct-12","Nov-12","Dec-12","Jan-13","Feb-13","Mar-13","Apr-13","May-13","Jun-13","Jul-13","Aug-13","Sep-13","Oct-13","Nov-13","Dec-13","Jan-14","Feb-14","Mar-14","Apr-14","May-14","Jun-14","Jul-14","Aug-14","Sep-14","Oct-14","Nov-14","Dec-14","Jan-15","Feb-15","Mar-15","Apr-15","May-15","Jun-15","Jul-15","Aug-15","Sep-15","Oct-15","Nov-15","Dec-15","Jan-16","Feb-16","Mar-16","Apr-16","May-16","Jun-16","Jul-16","Aug-16","Sep-16","Oct-16","Nov-16","Dec-16","Jan-17","Feb-17","Mar-17","Apr-17","May-17","Jun-17","Jul-17","Aug-17","Sep-17","Oct-17","Nov-17","Dec-17","Jan-18","Feb-18","Mar-18","Apr-18","May-18","Jun-18","Jul-18","Aug-18","Sep-18","Oct-18","Nov-18","Dec-18","Jan-19","Feb-19","Mar-19","Apr-19","May-19","Jun-19","Jul-19","Aug-19","Sep-19","Oct-19","Nov-19","Dec-19","Jan-20","Feb-20","Mar-20"],[[1537.6033279999999],[1540.9967180000001],[1545.262988],[1550.418606],[1555.5840229999999],[1560.492211],[1565.1036779999999],[1569.581518],[1573.821138],[1577.01505],[1578.596254],[1578.6977119999999],[1578.119099],[1577.3183919999999],[1577.448799],[1578.733757],[1580.622858],[1582.523811],[1583.813768],[1584.5038810000001],[1585.0958089999999],[1586.7405200000001],[1589.4022769999999],[1592.238441],[1594.179967],[1594.8796609999999],[1594.0824849999999],[1592.149527],[1590.3946289999999],[1589.77811],[1590.9340139999999],[1593.4730709999999],[1596.349655],[1598.7310440000001],[1600.2021259999999],[1601.2720200000001],[1602.450245],[1604.1759119999999],[1606.437009],[1608.894798],[1610.3582799999999],[1610.32638],[1609.0747240000001],[1607.545437],[1606.3419690000001],[1605.5555589999999],[1605.4977490000001],[1606.2950530000001],[1607.763391],[1609.701018],[1611.792909],[1613.5167240000001],[1614.3300469999999],[1614.281426],[1613.808552],[1613.9905779999999],[1615.7100399999999],[1619.2870359999999],[1623.7733920000001],[1628.050735],[1631.150578],[1632.9925009999999],[1634.263985],[1635.9679759999999],[1638.5578410000001],[1641.9663],[1645.9555350000001],[1650.2820139999999],[1653.875865],[1656.1706509999999],[1657.0036789999999],[1656.7110029999999],[1656.085223],[1655.658246],[1655.6788220000001],[1656.355039],[1657.946539],[1660.281526],[1662.734702],[1665.1420969999999],[1667.449897],[1669.5131670000001],[1671.5286189999999],[1674.1647009999999],[1677.834987],[1682.6296560000001],[1688.2800110000001],[1694.337663],[1700.5633620000001],[1706.4079979999999],[1711.605317],[1715.936001],[1719.253874],[1721.387706],[1722.3732950000001],[1723.014889],[1724.404751],[1726.9560220000001],[1730.6797670000001],[1735.1184780000001],[1739.4267379999999],[1743.3779039999999],[1746.8227529999999],[1750.0992650000001],[1753.817775],[1758.1277319999999],[1762.3318400000001],[1765.6222829999999],[1767.7341899999999],[1769.0200400000001],[1769.9394070000001],[1770.9175769999999],[1772.676455],[1775.3108099999999],[1777.9996229999999],[1779.846616],[1780.4976690000001],[1780.475248],[1780.0449980000001],[1779.3111039999999],[1781.6760650000001]],[[1525.4027779999999],[1537.683411],[1554.2230489999999],[1554.0479049999999],[1548.3944799999999],[1562.9271779999999],[1562.0795109999999],[1566.8026689999999],[1571.411122],[1569.4392230000001],[1581.986523],[1579.8828040000001],[1579.089835],[1554.9492749999999],[1573.4865600000001],[1581.9901359999999],[1582.8965840000001],[1584.1353340000001],[1581.3436340000001],[1590.7107490000001],[1585.9412159999999],[1587.08627],[1589.4801560000001],[1586.2832900000001],[1595.416502],[1599.563701],[1604.528431],[1578.260589],[1588.8540459999999],[1587.8487720000001],[1598.5530329999999],[1583.4129370000001],[1600.3650399999999],[1602.930327],[1601.434291],[1603.251698],[1596.9205629999999],[1613.122732],[1604.7863400000001],[1604.883304],[1615.2148749999999],[1619.219619],[1607.35303],[1606.657688],[1603.44841],[1604.33554],[1597.9195050000001],[1605.9929749999999],[1613.3509630000001],[1602.476911],[1610.0944480000001],[1617.0079639999999],[1615.2478209999999],[1615.2621409999999],[1611.017867],[1611.568724],[1612.5356730000001],[1599.9841019999999],[1629.368737],[1627.335024],[1635.9294199999999],[1638.7397269999999],[1635.1825020000001],[1632.9020370000001],[1639.4399800000001],[1637.073676],[1648.5919960000001],[1652.9777859999999],[1654.105405],[1650.9280739999999],[1661.2526029999999],[1663.5396699999999],[1653.8803539999999],[1633.7627669999999],[1662.8608280000001],[1655.8312619999999],[1660.794588],[1663.085075],[1659.2243960000001],[1664.999665],[1666.8882490000001],[1673.532608],[1694.4176190000001],[1662.6542930000001],[1676.6658930000001],[1665.7781649999999],[1710.617915],[1705.1943349999999],[1697.75398],[1703.1683700000001],[1711.117898],[1714.864828],[1727.763271],[1720.8395310000001],[1700.3811519999999],[1723.687754],[1723.875055],[1745.7580820000001],[1729.3355509999999],[1738.6857239999999],[1740.553531],[1741.5654970000001],[1746.7768410000001],[1753.332795],[1751.427459],[1749.741407],[1763.2103509999999],[1765.843063],[1774.2205349999999],[1772.2487269999999],[1766.3204109999999],[1765.8265859999999],[1773.584826],[1777.286441],[1780.97495],[1777.052027],[1779.614045],[1787.2927380000001],[1778.401732],[1775.3632709999999],[1784.906287]]]
[]
[{"axis_id":"0","tick_interval":"12","axis_min":"","axis_max":"","axis_title":"","precision":-1,"axis_units":"","tooltip_units":"","table_units":"","data_unit_prefix":"","data_unit_suffix":"","reverse_axis":false}][{"axis_id":"0","tick_interval":"50","axis_min":"1500","axis_max":"1800","axis_title":"millions","precision":"1","table_units":"(m)","tooltip_units":"(m)","axis_units":"","data_unit_prefix":"","data_unit_suffix":"","reverse_axis":false}]Participation
In March 2020, the participation rate:
- remained steady at 66.0%, and increased 0.2 pts over the year to March 2020
- decreased by less than 0.1 pts to 70.8% for men and remained steady for women (61.3%)
- increased by less than 0.1 pts to 78.8% for 15 to 64 year olds (the working age population). For 15 to 64 year old men, it was 83.1% and for 15 to 64 year old it was women 74.5%
- remained steady at 68.5% for 15 to 24 year olds
In seasonally adjusted terms, in March 2020, the participation rate:
- remained steady at 66.0%, and increased 0.3 pts over the year to March 2020
- remained steady for both men (70.8%) and women (61.3%)
- remained steady at 78.7% for 15 to 64 year olds (the working age population). For 15 to 64 year old men, it was 83.1% and for 15 to 64 year old women it was 74.4%
- remained steady at 68.5% for 15 to 24 year olds
| Trend (%) | Seasonally adjusted (%) | |
|---|---|---|
| Feb-10 | 65.3 | 65.2 |
| Mar-10 | 65.2 | 65.2 |
| Apr-10 | 65.2 | 65.3 |
| May-10 | 65.2 | 65.0 |
| Jun-10 | 65.2 | 65.2 |
| Jul-10 | 65.3 | 65.4 |
| Aug-10 | 65.4 | 65.4 |
| Sep-10 | 65.5 | 65.5 |
| Oct-10 | 65.6 | 65.7 |
| Nov-10 | 65.6 | 65.8 |
| Dec-10 | 65.6 | 65.6 |
| Jan-11 | 65.6 | 65.8 |
| Feb-11 | 65.5 | 65.5 |
| Mar-11 | 65.5 | 65.6 |
| Apr-11 | 65.4 | 65.4 |
| May-11 | 65.4 | 65.3 |
| Jun-11 | 65.4 | 65.3 |
| Jul-11 | 65.4 | 65.4 |
| Aug-11 | 65.4 | 65.4 |
| Sep-11 | 65.5 | 65.5 |
| Oct-11 | 65.4 | 65.4 |
| Nov-11 | 65.4 | 65.4 |
| Dec-11 | 65.3 | 65.1 |
| Jan-12 | 65.2 | 65.3 |
| Feb-12 | 65.2 | 65.1 |
| Mar-12 | 65.1 | 65.3 |
| Apr-12 | 65.1 | 65.1 |
| May-12 | 65.2 | 65.3 |
| Jun-12 | 65.2 | 65.1 |
| Jul-12 | 65.1 | 65.1 |
| Aug-12 | 65.1 | 65.0 |
| Sep-12 | 65.1 | 65.3 |
| Oct-12 | 65.1 | 65.2 |
| Nov-12 | 65.1 | 64.9 |
| Dec-12 | 65.1 | 65.0 |
| Jan-13 | 65.1 | 65.3 |
| Feb-13 | 65.1 | 65.2 |
| Mar-13 | 65.1 | 65.1 |
| Apr-13 | 65.1 | 65.2 |
| May-13 | 65.1 | 65.0 |
| Jun-13 | 65.0 | 65.1 |
| Jul-13 | 65.0 | 64.9 |
| Aug-13 | 64.9 | 64.9 |
| Sep-13 | 64.8 | 64.8 |
| Oct-13 | 64.8 | 64.8 |
| Nov-13 | 64.7 | 64.6 |
| Dec-13 | 64.6 | 64.5 |
| Jan-14 | 64.6 | 64.6 |
| Feb-14 | 64.6 | 64.6 |
| Mar-14 | 64.6 | 64.7 |
| Apr-14 | 64.6 | 64.7 |
| May-14 | 64.6 | 64.6 |
| Jun-14 | 64.7 | 64.7 |
| Jul-14 | 64.7 | 64.8 |
| Aug-14 | 64.7 | 64.6 |
| Sep-14 | 64.7 | 64.7 |
| Oct-14 | 64.7 | 64.7 |
| Nov-14 | 64.7 | 64.5 |
| Dec-14 | 64.7 | 64.6 |
| Jan-15 | 64.8 | 64.7 |
| Feb-15 | 64.8 | 64.9 |
| Mar-15 | 64.8 | 64.9 |
| Apr-15 | 64.8 | 64.8 |
| May-15 | 64.9 | 64.9 |
| Jun-15 | 64.9 | 64.8 |
| Jul-15 | 64.9 | 65.1 |
| Aug-15 | 65.0 | 64.9 |
| Sep-15 | 65.1 | 65.0 |
| Oct-15 | 65.1 | 65.2 |
| Nov-15 | 65.2 | 65.2 |
| Dec-15 | 65.2 | 65.1 |
| Jan-16 | 65.1 | 65.2 |
| Feb-16 | 65.1 | 65.0 |
| Mar-16 | 65.0 | 64.9 |
| Apr-16 | 65.0 | 64.9 |
| May-16 | 64.9 | 64.9 |
| Jun-16 | 64.9 | 64.9 |
| Jul-16 | 64.8 | 64.9 |
| Aug-16 | 64.7 | 64.7 |
| Sep-16 | 64.7 | 64.5 |
| Oct-16 | 64.7 | 64.5 |
| Nov-16 | 64.7 | 64.7 |
| Dec-16 | 64.7 | 64.8 |
| Jan-17 | 64.7 | 64.7 |
| Feb-17 | 64.8 | 64.7 |
| Mar-17 | 64.8 | 64.9 |
| Apr-17 | 64.9 | 64.9 |
| May-17 | 65.0 | 65.0 |
| Jun-17 | 65.1 | 65.1 |
| Jul-17 | 65.2 | 65.2 |
| Aug-17 | 65.3 | 65.3 |
| Sep-17 | 65.3 | 65.3 |
| Oct-17 | 65.4 | 65.3 |
| Nov-17 | 65.5 | 65.5 |
| Dec-17 | 65.6 | 65.8 |
| Jan-18 | 65.6 | 65.8 |
| Feb-18 | 65.6 | 65.7 |
| Mar-18 | 65.6 | 65.6 |
| Apr-18 | 65.6 | 65.6 |
| May-18 | 65.5 | 65.4 |
| Jun-18 | 65.5 | 65.7 |
| Jul-18 | 65.5 | 65.5 |
| Aug-18 | 65.5 | 65.6 |
| Sep-18 | 65.6 | 65.4 |
| Oct-18 | 65.6 | 65.5 |
| Nov-18 | 65.6 | 65.7 |
| Dec-18 | 65.6 | 65.7 |
| Jan-19 | 65.7 | 65.7 |
| Feb-19 | 65.7 | 65.6 |
| Mar-19 | 65.8 | 65.7 |
| Apr-19 | 65.9 | 65.9 |
| May-19 | 66.0 | 66.0 |
| Jun-19 | 66.0 | 66.0 |
| Jul-19 | 66.1 | 66.1 |
| Aug-19 | 66.1 | 66.2 |
| Sep-19 | 66.1 | 66.1 |
| Oct-19 | 66.0 | 66.0 |
| Nov-19 | 66.0 | 66.0 |
| Dec-19 | 66.0 | 66.0 |
| Jan-20 | 66.0 | 66.1 |
| Feb-20 | 66.0 | 66.0 |
| Mar-20 | 66.0 | 66.0 |
Participation rate
["","Trend","Seasonally adjusted"]
[["Feb-10","Mar-10","Apr-10","May-10","Jun-10","Jul-10","Aug-10","Sep-10","Oct-10","Nov-10","Dec-10","Jan-11","Feb-11","Mar-11","Apr-11","May-11","Jun-11","Jul-11","Aug-11","Sep-11","Oct-11","Nov-11","Dec-11","Jan-12","Feb-12","Mar-12","Apr-12","May-12","Jun-12","Jul-12","Aug-12","Sep-12","Oct-12","Nov-12","Dec-12","Jan-13","Feb-13","Mar-13","Apr-13","May-13","Jun-13","Jul-13","Aug-13","Sep-13","Oct-13","Nov-13","Dec-13","Jan-14","Feb-14","Mar-14","Apr-14","May-14","Jun-14","Jul-14","Aug-14","Sep-14","Oct-14","Nov-14","Dec-14","Jan-15","Feb-15","Mar-15","Apr-15","May-15","Jun-15","Jul-15","Aug-15","Sep-15","Oct-15","Nov-15","Dec-15","Jan-16","Feb-16","Mar-16","Apr-16","May-16","Jun-16","Jul-16","Aug-16","Sep-16","Oct-16","Nov-16","Dec-16","Jan-17","Feb-17","Mar-17","Apr-17","May-17","Jun-17","Jul-17","Aug-17","Sep-17","Oct-17","Nov-17","Dec-17","Jan-18","Feb-18","Mar-18","Apr-18","May-18","Jun-18","Jul-18","Aug-18","Sep-18","Oct-18","Nov-18","Dec-18","Jan-19","Feb-19","Mar-19","Apr-19","May-19","Jun-19","Jul-19","Aug-19","Sep-19","Oct-19","Nov-19","Dec-19","Jan-20","Feb-20","Mar-20"],[[65.286714900000007],[65.236597500000002],[65.186715699999993],[65.160911999999996],[65.184618400000005],[65.262977000000006],[65.375430399999999],[65.492897499999998],[65.588783300000003],[65.640270200000003],[65.641255900000004],[65.603917899999999],[65.542736399999995],[65.477848499999993],[65.426174399999994],[65.400940300000002],[65.400025099999993],[65.417551700000004],[65.444264899999993],[65.456899399999998],[65.441025300000007],[65.385995699999995],[65.3039524],[65.221495200000007],[65.164434299999996],[65.142504500000001],[65.145566599999995],[65.1579792],[65.161600000000007],[65.145689399999995],[65.114747800000004],[65.085332500000007],[65.065996999999996],[65.062404299999997],[65.073784700000004],[65.089060399999994],[65.103601999999995],[65.109145100000006],[65.097754899999998],[65.069352300000006],[65.025512800000001],[64.973408599999999],[64.909523500000006],[64.834576299999995],[64.753275900000006],[64.674419099999994],[64.606870999999998],[64.563727099999994],[64.552920200000003],[64.574421900000004],[64.611526999999995],[64.648972099999995],[64.676719599999998],[64.694353000000007],[64.701139100000006],[64.707375299999995],[64.716103599999997],[64.726909300000003],[64.740183700000003],[64.756337599999995],[64.776130699999996],[64.800338100000005],[64.828169399999993],[64.857816600000007],[64.893209299999995],[64.937923400000003],[64.997313300000002],[65.066096599999995],[65.127116599999994],[65.167619799999997],[65.171846099999996],[65.135377800000001],[65.075368800000007],[65.008285400000005],[64.951913200000007],[64.902600800000002],[64.850770800000006],[64.797957400000001],[64.748731000000006],[64.703247599999997],[64.676138199999997],[64.672691999999998],[64.688182800000007],[64.722128799999993],[64.7720226],[64.838594499999999],[64.924931200000003],[65.018339600000004],[65.105620000000002],[65.180516600000004],[65.251578699999996],[65.333115899999996],[65.423496999999998],[65.515082800000002],[65.594106800000006],[65.638401799999997],[65.636697400000003],[65.603448099999994],[65.559195500000001],[65.525297600000002],[65.516753399999999],[65.524752599999999],[65.541330599999995],[65.561203300000003],[65.579195100000007],[65.594525700000005],[65.616553400000001],[65.656847600000006],[65.716612299999994],[65.792564900000002],[65.879315399999996],[65.968065699999997],[66.041567900000004],[66.084748700000006],[66.0947022],[66.075375500000007],[66.043267299999997],[66.0130877],[65.993468699999994],[65.988420500000004],[65.997133899999994],[65.995884500000003]],[[65.2051175],[65.212394700000004],[65.264190600000006],[65.014917600000004],[65.206582900000001],[65.381944099999998],[65.364773600000007],[65.475673200000003],[65.655152299999997],[65.798935999999998],[65.595800800000006],[65.764034899999999],[65.507200499999996],[65.602502700000002],[65.357355299999995],[65.256354999999999],[65.308839699999993],[65.369784300000006],[65.444019400000002],[65.516721799999999],[65.406823399999993],[65.3529494],[65.107876899999994],[65.315366400000002],[65.113190099999997],[65.341507800000002],[65.058339000000004],[65.348685799999998],[65.091406000000006],[65.0571743],[64.985185900000005],[65.326987500000001],[65.182875199999998],[64.947656499999994],[65.043226700000005],[65.283945200000005],[65.222336400000003],[65.081475600000005],[65.152548300000007],[65.027839999999998],[65.0805431],[64.863618299999999],[64.889273200000005],[64.8495597],[64.836434699999998],[64.623666200000002],[64.4575909],[64.577106000000001],[64.574011100000007],[64.746560700000003],[64.680279299999995],[64.566529599999996],[64.679056399999993],[64.765416999999999],[64.626312100000007],[64.6511371],[64.652974099999994],[64.548389099999994],[64.636634799999996],[64.749712400000007],[64.890710299999995],[64.858097000000001],[64.810286399999995],[64.853180100000003],[64.809911700000001],[65.083202099999994],[64.941702599999999],[64.974611300000007],[65.160480699999994],[65.244755900000001],[65.139392000000001],[65.2408176],[65.004978100000002],[64.932245800000004],[64.905026300000003],[64.863331400000007],[64.882972100000003],[64.948419799999996],[64.662344899999994],[64.485147400000002],[64.539622699999995],[64.735070100000002],[64.818116700000004],[64.686736300000007],[64.712456900000006],[64.892753799999994],[64.945826699999998],[64.958554000000007],[65.088422800000004],[65.1613124],[65.295014800000004],[65.314520400000006],[65.262691000000004],[65.534605299999996],[65.809026799999998],[65.781252499999994],[65.699823499999994],[65.573505100000006],[65.612134100000006],[65.431878600000005],[65.665761200000006],[65.522465100000005],[65.624869399999994],[65.403841600000007],[65.5247648],[65.704647499999993],[65.679878200000005],[65.736819299999993],[65.592723599999999],[65.681867999999994],[65.887642499999998],[66.013327500000003],[65.992300599999993],[66.051863800000007],[66.154028199999999],[66.073917600000001],[65.965222499999996],[65.990878600000002],[65.998777399999994],[66.1042609],[65.987463700000006],[65.975529199999997]]]
[]
[{"axis_id":"0","tick_interval":"12","axis_min":"","axis_max":"","axis_title":"","precision":-1,"axis_units":"","tooltip_units":"","table_units":"","data_unit_prefix":"","data_unit_suffix":"","reverse_axis":false}][{"axis_id":"0","tick_interval":"0.5","axis_min":"64.0","axis_max":"66.5","axis_title":"%","precision":"1","table_units":"(%)","tooltip_units":"(%)","axis_units":"","data_unit_prefix":"","data_unit_suffix":"","reverse_axis":false}]Underemployment and underutilisation
In March 2020:
- the underemployment rate increased by 0.1 pts to 8.7% (0.4 pts higher than a year ago)
- the underutilisation rate increased by 0.1 pts to 13.9%
In seasonally adjusted terms, in March 2020:
- the underemployment rate increased by 0.1 pts to 8.8% (0.6 pts higher than a year ago)
- the underutilisation rate increased 0.2 pts to 14.0%
| Underemployment rate - Trend (%) | Underemployment rate - Seasonally adjusted (%) | Underutilisation rate - Trend (%) | Underutilisation rate - Seasonally adjusted (%) | |
|---|---|---|---|---|
| Mar-10 | 7.3 | 7.3 | 12.7 | 12.7 |
| Apr-10 | 7.2 | 7.1 | 12.5 | 12.6 |
| May-10 | 7.1 | 7.0 | 12.4 | 12.2 |
| Jun-10 | 7.1 | 7.0 | 12.3 | 12.2 |
| Jul-10 | 7.1 | 7.1 | 12.3 | 12.4 |
| Aug-10 | 7.1 | 7.2 | 12.3 | 12.2 |
| Sep-10 | 7.1 | 7.1 | 12.2 | 12.2 |
| Oct-10 | 7.1 | 7.0 | 12.2 | 12.3 |
| Nov-10 | 7.0 | 6.9 | 12.1 | 12.0 |
| Dec-10 | 7.0 | 7.0 | 12.0 | 11.8 |
| Jan-11 | 6.9 | 6.8 | 12.0 | 11.8 |
| Feb-11 | 6.9 | 6.9 | 11.9 | 11.9 |
| Mar-11 | 7.0 | 6.9 | 11.9 | 11.9 |
| Apr-11 | 7.0 | 7.0 | 11.9 | 12.0 |
| May-11 | 6.9 | 7.1 | 11.9 | 12.1 |
| Jun-11 | 6.9 | 7.0 | 11.9 | 11.9 |
| Jul-11 | 6.9 | 6.8 | 12.0 | 11.9 |
| Aug-11 | 6.8 | 6.7 | 12.0 | 12.0 |
| Sep-11 | 6.9 | 6.8 | 12.1 | 12.1 |
| Oct-11 | 6.9 | 6.9 | 12.2 | 12.1 |
| Nov-11 | 7.0 | 7.1 | 12.3 | 12.3 |
| Dec-11 | 7.1 | 7.1 | 12.3 | 12.3 |
| Jan-12 | 7.2 | 7.2 | 12.4 | 12.2 |
| Feb-12 | 7.2 | 7.3 | 12.4 | 12.5 |
| Mar-12 | 7.3 | 7.2 | 12.4 | 12.4 |
| Apr-12 | 7.3 | 7.3 | 12.4 | 12.3 |
| May-12 | 7.2 | 7.4 | 12.4 | 12.6 |
| Jun-12 | 7.1 | 7.2 | 12.3 | 12.3 |
| Jul-12 | 7.0 | 7.1 | 12.3 | 12.2 |
| Aug-12 | 7.0 | 6.9 | 12.3 | 12.0 |
| Sep-12 | 6.9 | 6.8 | 12.3 | 12.3 |
| Oct-12 | 6.9 | 7.0 | 12.3 | 12.4 |
| Nov-12 | 7.0 | 7.0 | 12.3 | 12.3 |
| Dec-12 | 7.0 | 7.0 | 12.4 | 12.5 |
| Jan-13 | 7.1 | 7.0 | 12.5 | 12.4 |
| Feb-13 | 7.1 | 7.1 | 12.6 | 12.5 |
| Mar-13 | 7.2 | 7.2 | 12.8 | 12.9 |
| Apr-13 | 7.3 | 7.2 | 12.9 | 12.8 |
| May-13 | 7.4 | 7.5 | 13.0 | 13.1 |
| Jun-13 | 7.4 | 7.5 | 13.1 | 13.2 |
| Jul-13 | 7.5 | 7.4 | 13.2 | 13.0 |
| Aug-13 | 7.5 | 7.6 | 13.2 | 13.4 |
| Sep-13 | 7.5 | 7.4 | 13.3 | 13.1 |
| Oct-13 | 7.5 | 7.5 | 13.3 | 13.3 |
| Nov-13 | 7.5 | 7.5 | 13.3 | 13.3 |
| Dec-13 | 7.5 | 7.5 | 13.3 | 13.4 |
| Jan-14 | 7.5 | 7.3 | 13.3 | 13.3 |
| Feb-14 | 7.5 | 7.5 | 13.3 | 13.4 |
| Mar-14 | 7.6 | 7.5 | 13.4 | 13.4 |
| Apr-14 | 7.7 | 7.7 | 13.5 | 13.5 |
| May-14 | 7.8 | 7.8 | 13.7 | 13.7 |
| Jun-14 | 8.0 | 7.9 | 14.0 | 14.0 |
| Jul-14 | 8.2 | 8.3 | 14.3 | 14.5 |
| Aug-14 | 8.3 | 8.4 | 14.5 | 14.4 |
| Sep-14 | 8.4 | 8.8 | 14.7 | 15.1 |
| Oct-14 | 8.5 | 8.2 | 14.8 | 14.6 |
| Nov-14 | 8.5 | 8.6 | 14.8 | 14.9 |
| Dec-14 | 8.5 | 8.5 | 14.8 | 14.6 |
| Jan-15 | 8.5 | 8.5 | 14.7 | 14.8 |
| Feb-15 | 8.5 | 8.5 | 14.6 | 14.6 |
| Mar-15 | 8.4 | 8.2 | 14.5 | 14.2 |
| Apr-15 | 8.4 | 8.3 | 14.5 | 14.5 |
| May-15 | 8.4 | 8.4 | 14.5 | 14.3 |
| Jun-15 | 8.4 | 8.4 | 14.5 | 14.4 |
| Jul-15 | 8.5 | 8.6 | 14.6 | 14.9 |
| Aug-15 | 8.6 | 8.4 | 14.6 | 14.5 |
| Sep-15 | 8.6 | 8.8 | 14.6 | 15.0 |
| Oct-15 | 8.6 | 8.7 | 14.6 | 14.6 |
| Nov-15 | 8.6 | 8.6 | 14.5 | 14.4 |
| Dec-15 | 8.5 | 8.5 | 14.4 | 14.2 |
| Jan-16 | 8.5 | 8.5 | 14.2 | 14.5 |
| Feb-16 | 8.4 | 8.3 | 14.1 | 14.0 |
| Mar-16 | 8.4 | 8.4 | 14.1 | 14.0 |
| Apr-16 | 8.5 | 8.6 | 14.2 | 14.3 |
| May-16 | 8.6 | 8.3 | 14.2 | 14.0 |
| Jun-16 | 8.6 | 8.8 | 14.3 | 14.5 |
| Jul-16 | 8.7 | 9.0 | 14.3 | 14.7 |
| Aug-16 | 8.7 | 8.8 | 14.3 | 14.4 |
| Sep-16 | 8.7 | 8.7 | 14.3 | 14.4 |
| Oct-16 | 8.6 | 8.5 | 14.3 | 14.1 |
| Nov-16 | 8.6 | 8.5 | 14.3 | 14.3 |
| Dec-16 | 8.7 | 8.6 | 14.4 | 14.5 |
| Jan-17 | 8.7 | 8.8 | 14.5 | 14.5 |
| Feb-17 | 8.7 | 9.0 | 14.5 | 14.9 |
| Mar-17 | 8.7 | 8.6 | 14.5 | 14.5 |
| Apr-17 | 8.7 | 8.8 | 14.4 | 14.4 |
| May-17 | 8.6 | 8.7 | 14.3 | 14.2 |
| Jun-17 | 8.6 | 8.4 | 14.2 | 14.0 |
| Jul-17 | 8.5 | 8.5 | 14.1 | 14.1 |
| Aug-17 | 8.5 | 8.6 | 14.0 | 14.1 |
| Sep-17 | 8.5 | 8.6 | 14.0 | 14.0 |
| Oct-17 | 8.5 | 8.5 | 14.0 | 13.9 |
| Nov-17 | 8.5 | 8.5 | 14.0 | 13.9 |
| Dec-17 | 8.5 | 8.5 | 14.0 | 14.1 |
| Jan-18 | 8.5 | 8.7 | 14.0 | 14.2 |
| Feb-18 | 8.5 | 8.5 | 14.0 | 14.1 |
| Mar-18 | 8.5 | 8.6 | 14.0 | 14.1 |
| Apr-18 | 8.5 | 8.5 | 14.0 | 14.0 |
| May-18 | 8.5 | 8.4 | 13.9 | 13.8 |
| Jun-18 | 8.4 | 8.6 | 13.8 | 13.9 |
| Jul-18 | 8.4 | 8.4 | 13.7 | 13.7 |
| Aug-18 | 8.4 | 8.2 | 13.6 | 13.4 |
| Sep-18 | 8.3 | 8.3 | 13.5 | 13.3 |
| Oct-18 | 8.3 | 8.3 | 13.4 | 13.3 |
| Nov-18 | 8.3 | 8.5 | 13.3 | 13.6 |
| Dec-18 | 8.3 | 8.3 | 13.3 | 13.3 |
| Jan-19 | 8.3 | 8.1 | 13.3 | 13.2 |
| Feb-19 | 8.3 | 8.0 | 13.3 | 13.0 |
| Mar-19 | 8.3 | 8.2 | 13.4 | 13.3 |
| Apr-19 | 8.3 | 8.5 | 13.5 | 13.7 |
| May-19 | 8.4 | 8.5 | 13.5 | 13.8 |
| Jun-19 | 8.4 | 8.2 | 13.6 | 13.4 |
| Jul-19 | 8.4 | 8.4 | 13.7 | 13.7 |
| Aug-19 | 8.4 | 8.5 | 13.7 | 13.8 |
| Sep-19 | 8.4 | 8.4 | 13.7 | 13.6 |
| Oct-19 | 8.4 | 8.5 | 13.7 | 13.8 |
| Nov-19 | 8.5 | 8.3 | 13.7 | 13.5 |
| Dec-19 | 8.5 | 8.3 | 13.7 | 13.4 |
| Jan-20 | 8.6 | 8.6 | 13.7 | 13.9 |
| Feb-20 | 8.6 | 8.6 | 13.7 | 13.7 |
| Mar-20 | 8.7 | 8.8 | 13.9 | 14.0 |
Underemployment rate and underutilisation rate
["","Underemployment rate - Trend","Underemployment rate - Seasonally adjusted","Underutilisation rate - Trend","Underutilisation rate - Seasonally adjusted"]
[["Mar-10","Apr-10","May-10","Jun-10","Jul-10","Aug-10","Sep-10","Oct-10","Nov-10","Dec-10","Jan-11","Feb-11","Mar-11","Apr-11","May-11","Jun-11","Jul-11","Aug-11","Sep-11","Oct-11","Nov-11","Dec-11","Jan-12","Feb-12","Mar-12","Apr-12","May-12","Jun-12","Jul-12","Aug-12","Sep-12","Oct-12","Nov-12","Dec-12","Jan-13","Feb-13","Mar-13","Apr-13","May-13","Jun-13","Jul-13","Aug-13","Sep-13","Oct-13","Nov-13","Dec-13","Jan-14","Feb-14","Mar-14","Apr-14","May-14","Jun-14","Jul-14","Aug-14","Sep-14","Oct-14","Nov-14","Dec-14","Jan-15","Feb-15","Mar-15","Apr-15","May-15","Jun-15","Jul-15","Aug-15","Sep-15","Oct-15","Nov-15","Dec-15","Jan-16","Feb-16","Mar-16","Apr-16","May-16","Jun-16","Jul-16","Aug-16","Sep-16","Oct-16","Nov-16","Dec-16","Jan-17","Feb-17","Mar-17","Apr-17","May-17","Jun-17","Jul-17","Aug-17","Sep-17","Oct-17","Nov-17","Dec-17","Jan-18","Feb-18","Mar-18","Apr-18","May-18","Jun-18","Jul-18","Aug-18","Sep-18","Oct-18","Nov-18","Dec-18","Jan-19","Feb-19","Mar-19","Apr-19","May-19","Jun-19","Jul-19","Aug-19","Sep-19","Oct-19","Nov-19","Dec-19","Jan-20","Feb-20","Mar-20"],[[7.2845523999999999],[7.1835817999999998],[7.1143036000000004],[7.0856006000000002],[7.0880551000000001],[7.0996663],[7.0954252999999996],[7.0641879999999997],[7.0164555999999996],[6.9710695999999999],[6.9456721999999997],[6.9445147],[6.9532812000000002],[6.9513742000000001],[6.9282339999999998],[6.8897035000000004],[6.8529761000000002],[6.8389867000000004],[6.8636938000000001],[6.9263424000000002],[7.0148723999999998],[7.1085772],[7.1893789999999997],[7.2444706999999999],[7.2680477999999997],[7.2531409],[7.2000506],[7.1224365000000001],[7.0427765000000004],[6.9816878999999998],[6.9486318999999996],[6.9465507999999998],[6.9680004000000002],[7.0047787000000001],[7.0571919000000003],[7.1207107000000001],[7.1976597],[7.2839299999999998],[7.3677840000000003],[7.4333270999999996],[7.4744273000000003],[7.4924432000000003],[7.4938832],[7.4852745000000001],[7.4751804999999996],[7.4723153],[7.4768512999999999],[7.5028933000000002],[7.5664746000000003],[7.6730524000000004],[7.8198257],[7.9944382000000003],[8.1737456000000002],[8.3308204999999997],[8.4482583000000009],[8.5177095999999999],[8.5409986999999994],[8.5290634999999995],[8.4943290999999999],[8.4517897000000008],[8.4087332000000004],[8.3824135000000002],[8.3887718000000007],[8.4311147000000002],[8.4974734000000005],[8.5716178000000003],[8.6248044000000004],[8.6372526000000001],[8.6061469000000006],[8.5407884999999997],[8.4691145999999993],[8.4228924999999997],[8.4237967999999999],[8.4780966000000006],[8.5623667999999995],[8.6437529000000008],[8.6915981000000002],[8.6938175999999991],[8.6656177999999997],[8.6345459000000009],[8.6257287999999992],[8.6539509999999993],[8.7025211999999996],[8.7369517000000005],[8.7358051999999997],[8.6957240999999996],[8.6333079000000001],[8.5744565000000001],[8.5356318000000009],[8.5189465000000002],[8.5153412999999993],[8.5182224000000009],[8.5225124999999995],[8.5192087000000001],[8.5134468000000005],[8.5143036999999993],[8.5145823000000007],[8.5063411999999996],[8.4833362000000001],[8.4461370000000002],[8.4031649999999996],[8.3645922000000006],[8.3349613999999992],[8.3107051999999992],[8.2871819999999996],[8.2727283000000007],[8.2694305000000004],[8.2727274000000008],[8.2901710000000008],[8.3217461000000004],[8.3624123000000008],[8.4005097000000006],[8.4225771999999992],[8.4291981000000007],[8.4334865000000008],[8.4474959999999992],[8.4754286000000008],[8.5120161999999997],[8.5521803999999992],[8.5932806999999993],[8.6616575000000005]],[[7.2940734999999997],[7.1079384000000001],[6.9904140999999997],[7.0347166999999997],[7.0681948999999999],[7.1863182999999999],[7.1435532999999998],[7.0494975000000002],[6.9119915000000001],[6.9543942999999997],[6.8391688999999998],[6.8771092999999999],[6.9493372999999998],[7.0264949999999997],[7.0695952000000002],[6.9839260000000003],[6.8039516000000004],[6.7485849],[6.8309052000000001],[6.9442982000000004],[7.0641673000000003],[7.1352120000000001],[7.1537401999999997],[7.2687229000000002],[7.2348299999999997],[7.2987764000000004],[7.3531993],[7.1841086000000001],[7.0506672999999997],[6.9049173000000001],[6.8393613000000002],[6.9879496000000003],[7.0390230999999996],[7.0266225999999996],[6.9865333999999999],[7.0692221999999996],[7.2279841999999999],[7.2161268999999999],[7.4576371999999997],[7.5460159000000004],[7.3697248000000002],[7.5702327],[7.4452312999999997],[7.5123103000000002],[7.4678750000000003],[7.5172661999999999],[7.3290299000000001],[7.5088679999999997],[7.5341811999999999],[7.6624993000000003],[7.7604633999999999],[7.9261976000000001],[8.2856331000000001],[8.3649462999999997],[8.8331295999999995],[8.2027982999999995],[8.6471567],[8.4529318999999994],[8.5103579000000007],[8.4970692000000003],[8.1534639999999996],[8.3382959999999997],[8.3815107999999992],[8.3793398999999997],[8.6143111000000001],[8.4142913000000004],[8.7954547999999999],[8.7144116],[8.5815905000000008],[8.4668744999999994],[8.5072588000000007],[8.3489813000000002],[8.3912998999999999],[8.6422793000000002],[8.3165922000000005],[8.7707765999999996],[8.9892763999999996],[8.7766532999999995],[8.7306352999999994],[8.5376612000000005],[8.5097153999999993],[8.6194266000000006],[8.7729669999999995],[9.0192847999999994],[8.6074183000000009],[8.7752554000000007],[8.6683509999999995],[8.4196439000000005],[8.5110396999999995],[8.5744954],[8.5579967000000003],[8.4970072999999999],[8.5249571999999993],[8.4904606000000005],[8.7208097999999996],[8.4961389999999994],[8.5710087000000001],[8.4798106000000004],[8.4130675000000004],[8.5826677],[8.4493399999999994],[8.1759693999999996],[8.3279627000000005],[8.2688742000000008],[8.5211503999999998],[8.3382287999999996],[8.1090785000000007],[8.0495274000000006],[8.2246074999999994],[8.5156566999999992],[8.5492272000000007],[8.1928797000000007],[8.4088320000000003],[8.5230508999999994],[8.3724898999999997],[8.5173248000000008],[8.3273411999999993],[8.2875653000000007],[8.5898302999999991],[8.6267201999999994],[8.7749298000000007]],[[12.6574217],[12.514536700000001],[12.396199899999999],[12.319026600000001],[12.2784946],[12.252444499999999],[12.218484999999999],[12.162203999999999],[12.0876132],[12.0121299],[11.959016099999999],[11.934813399999999],[11.9297998],[11.9335308],[11.934868700000001],[11.936790500000001],[11.9600992],[12.0142753],[12.094007299999999],[12.1866219],[12.2737441],[12.3370339],[12.377058399999999],[12.398950299999999],[12.406462899999999],[12.3969921],[12.3711921],[12.331463400000001],[12.2903568],[12.263451999999999],[12.2577532],[12.2765117],[12.3234326],[12.3990315],[12.5012547],[12.620380600000001],[12.7559681],[12.892127],[13.0129561],[13.1044161],[13.1706298],[13.217987000000001],[13.2579584],[13.2915525],[13.3144735],[13.3268536],[13.329269],[13.347469500000001],[13.4121261],[13.539855599999999],[13.739309499999999],[13.9938565],[14.2645181],[14.5061962],[14.689644400000001],[14.7956889],[14.826672],[14.7960314],[14.7221858],[14.6309597],[14.543113399999999],[14.4878204],[14.4788645],[14.5123339],[14.565579400000001],[14.614619899999999],[14.6257404],[14.5828018],[14.487026699999999],[14.357089],[14.2312954],[14.1439346],[14.1153382],[14.150819800000001],[14.219258200000001],[14.2859438],[14.3249773],[14.327973800000001],[14.3107065],[14.3102337],[14.3484096],[14.4229447],[14.4956861],[14.5260056],[14.4931284],[14.4034893],[14.2843275],[14.168404799999999],[14.0754532],[14.0163206],[13.987731200000001],[13.9780912],[13.9820777],[13.9935914],[14.0071631],[14.0178134],[14.0094023],[13.97259],[13.9022899],[13.806114300000001],[13.6947087],[13.581993300000001],[13.481082199999999],[13.3955515],[13.328545699999999],[13.291689],[13.2914505],[13.320956199999999],[13.379629599999999],[13.457911599999999],[13.5454916],[13.624519400000001],[13.6723476],[13.6858501],[13.6777923],[13.664211999999999],[13.655475300000001],[13.6545807],[13.6670322],[13.691489300000001],[13.8556455]],[[12.717285800000001],[12.6084259],[12.2206411],[12.1802645],[12.3541653],[12.206826599999999],[12.1967549],[12.335295],[12.0205006],[11.831547499999999],[11.842079099999999],[11.8641232],[11.8750599],[11.9870264],[12.0837392],[11.9013615],[11.8925985],[12.0035168],[12.051842000000001],[12.1335525],[12.293748300000001],[12.3321235],[12.1994203],[12.4842409],[12.415603600000001],[12.2934041],[12.5547989],[12.347968],[12.226316799999999],[12.046828100000001],[12.3268793],[12.401350600000001],[12.2939463],[12.459735200000001],[12.372308],[12.498293500000001],[12.863310500000001],[12.803777500000001],[13.0689153],[13.2428597],[12.994497000000001],[13.390076000000001],[13.148700399999999],[13.3389772],[13.263814699999999],[13.418761099999999],[13.2632137],[13.41113],[13.4029288],[13.466836199999999],[13.6908893],[13.9754612],[14.453222999999999],[14.448160100000001],[15.0550783],[14.567619199999999],[14.946311100000001],[14.559722000000001],[14.8487179],[14.6161137],[14.2471405],[14.4504696],[14.3126189],[14.387907],[14.879265200000001],[14.496364399999999],[14.951060200000001],[14.633126900000001],[14.4386166],[14.2128929],[14.5316762],[14.0209267],[14.0370192],[14.286807599999999],[14.0360941],[14.464382199999999],[14.6713311],[14.380263100000001],[14.366522399999999],[14.1206988],[14.2761669],[14.453621],[14.4587275],[14.8565635],[14.453893600000001],[14.391790500000001],[14.2091121],[14.0165547],[14.0881723],[14.0835896],[13.9935659],[13.8617022],[13.9495173],[14.1018104],[14.228835200000001],[14.053557700000001],[14.080811600000001],[14.0189197],[13.804684200000001],[13.900522],[13.7199404],[13.4386902],[13.3294712],[13.268353899999999],[13.6319246],[13.3483786],[13.1602706],[13.0073635],[13.3099145],[13.737758400000001],[13.757361299999999],[13.4456577],[13.656647700000001],[13.7800007],[13.559510100000001],[13.8193929],[13.498680999999999],[13.3501943],[13.8798677],[13.7240319],[14.006429499999999]]]
[]
[{"axis_id":"0","tick_interval":"12","axis_min":"","axis_max":"","axis_title":"","precision":-1,"axis_units":"","tooltip_units":"","table_units":"","data_unit_prefix":"","data_unit_suffix":"","reverse_axis":false}][{"axis_id":"0","tick_interval":"2","axis_min":"6.0","axis_max":"16.0","axis_title":"%","precision":"1","table_units":"(%)","tooltip_units":"(%)","axis_units":"","data_unit_prefix":"","data_unit_suffix":"","reverse_axis":false}]States and territories
| New South Wales | Victoria | Queensland | South Australia | Western Australia | Tasmania | Northern Territory | Australian Capital Territory | Australia | |
|---|---|---|---|---|---|---|---|---|---|
| Employed persons | 4,138,100 | 3,454,400 | 2,567,100 | 852,000 | 1,368,900 | 258,200 | 134,300 | 238,700 | 13,020,500 |
| Employed persons - monthly change | 0.1% | 0.1% | 0.2% | 0.1% | 0.1% | 0.2% | 0.5% | 0.5% | 0.1% |
| Employment to population ratio | 62.3% | 63.1% | 62.0% | 58.8% | 64.4% | 58.1% | 71.8% | 69.5% | 62.6% |
| Employment to population ratio - monthly change | 0.0 pts | 0.0 pts | 0.0 pts | 0.0 pts | 0.0 pts | 0.0 pts | 0.4 pts | 0.2 pts | 0.0 pts |
| Unemployment rate | 4.7% | 5.2% | 5.7% | 6.0% | 5.4% | 5.3% | 5.5% | 3.0% | 5.2% |
| Unemployment rate - monthly change | 0.0 pts | 0.1 pts | -0.1 pts | 0.0 pts | 0.0 pts | -0.1 pts | 0.0 pts | 0.0 pts | 0.0 pts |
| Underemployment rate | 8.4% | 8.4% | 8.8% | 9.9% | 9.2% | 11.3% | 5.7% | 5.4% | 8.7% |
| Underemployment rate - monthly change | 0.0 pts | 0.1 pts | 0.0 pts | 0.1 pts | 0.1 pts | 0.1 pts | 0.1 pts | -0.1 pts | 0.1 pts |
| Participation rate | 65.4% | 66.5% | 65.7% | 62.6% | 68.1% | 61.4% | 76.0% | 71.7% | 66.0% |
| Participation rate - monthly change | 0.0 pts | 0.0 pts | 0.0 pts | 0.1 pts | 0.0 pts | 0.0 pts | 0.4 pts | 0.3 pts | 0.0 pts |
Data downloads
Labour force status
Table 1. Labour force status by Sex, Australia - Trend, Seasonally adjusted and Original
Data files
Table 4. Labour force status by Sex, New South Wales - Trend, Seasonally adjusted and Original
Data files
Table 5. Labour force status by Sex, Victoria - Trend, Seasonally adjusted and Original
Data files
Table 6. Labour force status by Sex, Queensland - Trend, Seasonally adjusted and Original
Data files
Table 7. Labour force status by Sex, South Australia - Trend, Seasonally adjusted and Original
Data files
Table 8. Labour force status by Sex, Western Australia - Trend, Seasonally adjusted and Original
Data files
Table 9. Labour force status by Sex, Tasmania - Trend, Seasonally adjusted and Original
Data files
Table 10. Labour force status by Sex, Northern Territory - Trend and Original
Data files
Table 11. Labour force status by Sex, Australian Capital Territory - Trend and Original
Data files
Table 12. Labour force status by Sex, State and Territory - Trend, Seasonally adjusted and Original
Data files
Table 13. Labour force status for 15-24 year olds by Sex - Trend, Seasonally adjusted and Original
Data files
Table 15. Labour force status for 15-24 year olds by Educational attendance (full-time) and Sex
Data files
Table 16. Labour force status for 15-24 year olds by State, Territory and Educational attendance (full-time)
Data files
Table 17. Labour force status for 15-19 year olds by Sex - Trend, Seasonally adjusted and Original
Data files
Table 18. Labour force status for 15-64 year olds by Sex - Trend, Seasonally adjusted and Original
Data files
Hours worked
Table 19. Monthly hours worked in all jobs by Employed full-time, part-time and Sex and by State and Territory - Trend and Seasonally adjusted
Data files
Table 21. Quarterly hours worked in all jobs by Market and Non-market sector - Seasonally adjusted
Data files
Underemployment and underutilisation
Table 22. Underutilised persons by Age and Sex - Trend, Seasonally adjusted and Original
Data files
Table 23. Underutilised persons by State and Territory and Sex - Trend, Seasonally adjusted and Original
Data files
Table 24. Underutilised persons by Age and Sex (expanded analytical series)
Data files
Table 25. Underutilised persons by State, Territory and Sex (expanded analytical series)
Data files
Flows into and out of employment
GM1 - Labour force status and Gross changes (flows) by Age, Sex, State and Territory, February 1991 onwards
Data files
All time series spreadsheets
All Time Series Spreadsheets
Data files
Article archive
LFS content and output
ABS Labour Statistics: A broad range of information (July 2019)
500th issue of 6202.0 (January 2018)
Labour Force Survey pivot tables (August 2017)
Expanded education data from the Labour Force Survey (August 2016)
Change to Status in Employment output (July 2015
Forthcoming improvements to the content of the Labour Force and Labour Supplementary Surveys (January 2013)
Upcoming changes to the Labour Force Survey (July 2012)
Labour Household Surveys content review (June 2012)
Understanding the labour force
Labour Force Explained (September 2017)
Understanding the Australian labour force using ABS statistics (December 2013)
Understanding full-time / part-time status in the Labour Force Survey (September 2013)
Employment level estimates versus employment to population ratio explained (January 2012)
Employment and jobs
How many people work one hour a week (January 2019)
Leave entitlements (November 2015)
Duration of employment (November 2015)
Sector of main job (November 2015)
Estimating jobs in the Australian labour market (February 2013)
Employment in mining in Queensland, New South Wales and Western Australia (May 2012)
Unemployment and underemployment
Underemployment in Australia (September 2018)
Spotlight on underemployment (November 2016)
Meaasures of underemployment and underutilisation (November 2015)
Full-time and part-time job search (November 2015)
Hours-based measures of unemployment and underemployment (November 2015)
Retrenchment (November 2015)
Did you know - Underemployment (June 2013)
Exploring labour force data on joblessness (February 2012)
Hours worked
Insights into detailed Labour Force Survey hours worked data (February 2020)
Revisions to monthly hours worked in all jobs (July 2016)
Regional estimates
Advice on reporting regional labour force data (December 2017)
Analysis of changes to Labour Force regional estimates (February 2014)
Methodology
Improvement to the trending method for Labour Force rates and ratios (October 2019)
Assessing volatility in Labour Force statistics (July 2019)
On-line collection in the Labour Force Survey (April 2019)
Annual seasonal re-analysis (March 2019)
Improvements to trend estimation (March 2018)
Major re-benchmarking of Labour Force series (October 2017)
Changes to filter lengths used in labour statistics (February 2017)
Update on recommendation 7 from the independent technical review (November 2015)
Progress with recommendations from the independent technical review (July 2015)
Update on recommendations 10 and 11 from the independent technical review (June 2015)
Update on recommendation 7 from the independent technical review (May 2015)
Update on recommendations from the independent technical review (March 2015)
Rebenchmarking Labour Force estimates (February 2015)
Independent technical review into the Labour Force Survey (November 2014)
Removing the effect of supplementary surveys from seasonally adjusted estimates (October 2014)
Rebenchmarking Labour Force estimates to the 2011 Census (January 2014)
New Labour Force sample design (May 2013)
Transition to online collection of the Labour Force survey (April 2013)
Rebenchmarking of Labour Force series (November 2012)
Population benchmarks and Labour Force Survey (April 2012)
Historical revisions (February 2011)
Impact of the floods on the Labour Force Survey (January 2011)