Feature Article: People who work few hours
INTRODUCTION
The ABS definition of employment, used in the Labour Force Survey, counts as employed anyone who undertook paid work for one hour or more in the reference week of the Labour Force Survey. From an economic perspective, such work contributes to the production of goods and services and is therefore counted as employment, in line with International Labour Organisation standards. From a social perspective, though, of interest are people who usually work a relatively small number of hours. Some of these people may choose to work few hours to allow time for other aspects of their life (e.g. childcare or study). Others may be at risk of experiencing financial disadvantage or of not having their aspirations for work met.
This article focuses on people who were employed part-time in November 2004, particularly those working a relatively small number of hours. In ABS household surveys, people employed part-time are those who usually work less than 35 hours a week in all jobs (end note 1).
The fact that some people work few hours is of concern if these people are not satisfied with the amount of work they have. There are various measures that can be used to provide information on this issue, including measures of underemployed workers. Underemployed workers include part-time workers who want, and are available for, more hours of work than they currently have.
As the ABS provides a wide range of data on underutilised labour, including underemployment (see the spotlight 'Annual measures of labour underutilisation', in this issue of Australian Labour Market Statistics, for more information), this article instead focuses on people who usually work 1-7 hours per week and who would prefer to work more hours (regardless of whether they are in a position to be able to or not).
This article examines the characteristics (e.g. age, sex, occupation) of those people who were employed in November 2004 and reported that they usually worked less than eight hours a week, and compares these people with other part-time workers.
OVERVIEW
In November 2004, there were 9.8 million people who were employed. Of these, 2.9 million people (or 30%) usually worked less than 35 hours a week in all jobs. About 400,000 people (or 4% of all employed people) usually worked less than 8 hours a week.
1. Employed people, By hours usually worked in all jobs each week - Nov 2004 |
|  |
| People
| |
| Hours usually worked in all jobs each week | '000 | % | |
| |
| 0 | 29.9 | 0.3 | |
| 1-7 | 369.6 | 3.8 | |
| 8-14 | 563.5 | 5.8 | |
| 15-24 | 1,044.0 | 10.7 | |
| 25-34 | 894.6 | 9.1 | |
| 35-39 | 1,917.1 | 19.6 | |
| 40 or more | 4,967.7 | 50.8 | |
| Total | 9,786.5 | 100.0 | |
| |
| Labour Force Survey. |
People who usually work 0 hours a week are counted as employed in the Labour Force Survey if they actually worked one hour or more in the reference week of the survey. In November 2004 there were about 30,000 people in this category. However, the focus of this article is on people who are working part-time rather than those who usually don't work, so those people who usually worked 0 hours a week have been excluded from the analysis in the rest of this article.
People who work few hours are more likely to be women than men (more than twice as many women as men usually worked 1-7 hours per week in November 2004), but the men who work few hours are more likely than women to want more hours. People who work few hours tend to be young (about 43% of those working these hours were aged 15-24 years in November 2004), are often students, and are most often working as either clerical, sales and service workers or labourers. Their main source of income tends to be either government pensions or allowances in cases where no other person in the household is employed, or the wages and salaries of others in the household. These characteristics are explored in more detail below.
Preference for more hours
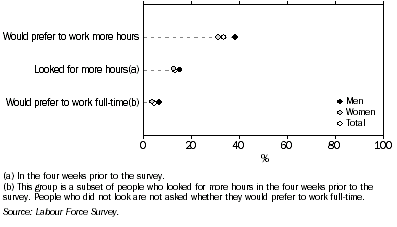
In November 2004, most people who usually worked 1-7 hours a week did not want to work more hours. Overall, about one-third (33%) of those people who worked 1-7 hours a week wanted to work more hours. The proportion was higher for men (38%) than for women (31%).
In November 2004, about 13% of people who usually worked 1-7 hours a week had looked for more hours of work at some time in the four weeks before the survey. About 4% of people who usually worked 1-7 hours would have preferred to work full-time and were looking for additional work. This proportion was slightly higher for men (7%) than women (4%).
2. People who usually work 1-7 hours per week - Nov 2004
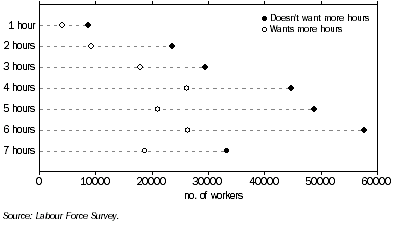
In November 2004, relatively few people (12,600 people, or 0.1% of all those who were employed) usually worked 1 hour per week. Most (56%) of the 369,600 people who worked between one and seven hours per week usually worked 5-7 hours.
3. People who usually work 1-7 hours per week, Whether would prefer more hours - Nov 2004
Underemployed workers
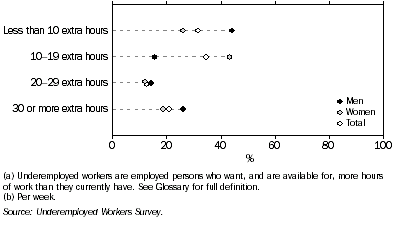
In September 2004, about two-thirds (66%) of underemployed people who usually worked 1-7 hours per week, wanted less than 19 additional hours of work per week (end note 2). There were some differences between the preferences of men and women. About 44% of men who usually worked 1-7 hours wanted less than 10 extra hours per week, while 26% wanted 30 or more additional hours per week. Women who usually worked 1-7 hours per week were more likely to want between 10 and 19 extra hours (43% wanted this amount), followed by 1-10 extra hours (26%).
4. Extra hours of work wanted, Underemployed(a) people who usually work 1-7 hours(b) - Sept 2004
AGE AND SEX
In November 2004, almost 70% of the people who usually worked 1-7 hours per week were women. However, women were less likely than men to want to work more hours (31% of women working 1-7 hours per week would have preferred to work more hours, compared to 38% of men).
Men who worked 1-7 hours tended to be concentrated in the younger and older age groups. About 62% of men working these hours were younger than 25 years, and another 22% were at least 55 years. For men, working relatively few hours is associated with balancing work with education (see 'students' below for more detail on people aged 15-24 years who are studying) or with the transition to retirement (for those aged 55 years or older).
In November 2004, people aged 35-44 years who usually worked 1-7 hours per week were more likely than other age groups to prefer to work more hours. This was particularly noticeable for men, with 86% wanting more hours. About 40% of women aged 35-44 years would have preferred to work more hours.
Women, like men, who worked 1-7 hours were more likely to be aged 15-24 years than any other age group (35% of women working those hours were 15-24 years). However, women were much less concentrated in any one age group than men. Almost half (49%) of women working 1-7 hours per week were aged 25-54 years. Many of these women had children who were younger than 15 years (see 'relationship in household', below, for more detail).
5. People who usually work part-time, By age and sex - Nov 2004 |
| |
| | People who usually work 1-7 hours per week
| People who usually work 8-34 hours per week
| |
| | Males | Females | Total | Males | Females | Total | |
People who usually work part-time | |
| |
| People (no.) | 114,350 | 255,290 | 369,640 | 718,096 | 1,783,953 | 2,502,049 | |
| People who would prefer to work more hours (no.) | 43,773 | 79,704 | 123,477 | 236,668 | 381,435 | 618,102 | |
| People who looked for more hours and would prefer to work full-time (no.) | 7,439 | 9,012 | 16,451 | 90,382 | 112,331 | 202,713 | |
| Proportion who would prefer to work more hours (%) | 38.3 | 31.2 | 33.4 | 33.0 | 21.4 | 24.7 | |
| Proportion who looked for more hours and would prefer to work full-time (%) | 6.5 | 3.5 | 4.5 | 12.6 | 6.3 | 8.1 | |
People usually working 1-7 or 8-34 hours per week, by age (%) | |
| |
| Age (years) | | | | | | | |
| 15-19 | 48.8 | 24.7 | 32.2 | 20.5 | 11.3 | 13.9 | |
| 20-24 | 13.1 | 10.3 | 11.1 | 17.3 | 10.3 | 12.3 | |
| 25-34 | 5.3 | 16.4 | 13.0 | 15.7 | 17.1 | 16.7 | |
| 35-44 | 4.7 | 18.6 | 14.3 | 13.0 | 26.2 | 22.4 | |
| 45-54 | 5.7 | 14.3 | 11.6 | 13.9 | 22.3 | 19.9 | |
| 55+ | 22.4 | 15.7 | 17.8 | 19.5 | 12.8 | 14.8 | |
| Total | 100.0 | 100.0 | 100.0 | 100.0 | 100.0 | 100.0 | |
Proportion of each age group usually working 1-7 or 8-34 hours per week who would prefer to work more hours (%) | |
| |
| Age (years) | | | | | | | |
| 15-19 | 36.8 | 36.9 | 36.8 | 29.2 | 33.5 | 31.7 | |
| 20-24 | 37.9 | 37.0 | 37.3 | 41.0 | 36.5 | 38.4 | |
| 25-34 | *34.9 | 22.5 | 24.1 | 41.3 | 21.4 | 26.8 | |
| 35-44 | 86.1 | 40.1 | 44.8 | 36.0 | 17.2 | 20.3 | |
| 45-54 | *50.4 | 31.1 | 34.0 | 39.2 | 19.4 | 23.4 | |
| 55+ | 29.4 | 17.2 | 21.9 | 16.5 | 10.6 | 12.9 | |
| |
| * estimate is subject to sampling variability too high for most practical purposes |
Students
Most young people (aged 15-24 years) who were usually working 1-7 hours were balancing part-time work with full-time study or school.
In November 2004, over nine out of ten (93%) people who were aged 15-19 years and usually worked 1-7 hours per week were studying full-time (either at school or other educational institutions).
Of people aged 20-24 years who were working 1-7 hours, 76% were studying full-time, a slightly lower proportion than for those aged 15-19 years.
RELATIONSHIP IN HOUSEHOLD
In November 2004, most of the people who usually worked 1-7 hours per week were either dependent students or were women who had children who were less than 15 years old.
Dependent students
Overall, about 32% of people who usually worked 1-7 hours per week were dependent students (end note 3). About one-quarter (25%) of women working 1-7 hours were dependent students, and nearly half (48%) of the men working 1-7 hours were dependent students. For dependent students the income earned from their employment may be supplementary rather than essential to pay the costs of living.
Women
In November 2004, the largest group of women who usually worked 1-7 hours were those who had a partner and had children who were younger than 15 years (this group made up 31% of all women working few hours), and three-quarters of these did not want to work more hours, suggesting that many of these women were combining work with caring for children, and had a partner's income to supplement their own. Another 6% of women working 1-7 hours per week were single parents with children, and over half (52%) of these women would have preferred to work more hours.
The third largest group of women, after the group above and dependent students, usually working 1-7 hours per week was 'spouse/partner with no children' (14%). About 64% of women in this group were 55 years or older.
Men
After dependent students, the second largest group of men usually working 1-7 hours per week was those who had a partner but no children (15% of the 114,400 men usually working 1-7 hours per week were in this situation). Most of these men (86%) were 55 years or older. 'Non-dependent child' was the third largest group for males, accounting for 7% of those working 1-7 hours per week in November 2004 (end note 4). Unlike women, the proportion of all men working 1-7 hours per week who had a partner and children was relatively low (4%).
6. People who usually work part-time, By sex and relationship in household - Nov 2004 |
| |
| | | People who usually work 1-7 hours per week
| People who usually work 8-34 hours per week
| |
| | | Males | Females | Total | Males | Females | Total | |
People who usually work part-time | |
| |
| People (no.) | 114,349.7 | 255,290 | 369,640 | 718,096 | 1,783,953 | 2,502,049 | |
| People who would prefer to work more hours (no.) | 43,773 | 79,704 | 123,477 | 236,668 | 381,435 | 618,102 | |
| Proportion who would prefer to work more hours (%) | 38.3 | 31.2 | 33.4 | 33.0 | 21.4 | 24.7 | |
Proportion of all people usually working 1-7 or 8-34 hours (%) | |
| |
| Relationship in household(a) | | | | | | | |
| Spouse or partner with | | | | | | | |
| | Children under 15 years | 4.1 | 30.6 | 22.4 | 14.7 | 31.6 | 26.8 | |
| | No children under 15 years, but with dependent students | *2.1 | 2.2 | 2.2 | 3.0 | 5.8 | 5.0 | |
| | No dependants but with children aged 15 years or older | 4.0 | 4.2 | 4.1 | 3.6 | 5.8 | 5.2 | |
| | No children | 14.9 | 14.0 | 14.3 | 19.8 | 18.9 | 19.1 | |
| Single parent with | | | | | | | |
| | Children under 15 years | *0.9 | 6.4 | 4.7 | 1.4 | 6.3 | 4.9 | |
| | No children under 15 years, but with dependent students | * - | *0.7 | *0.5 | *0.2 | 1.1 | 0.9 | |
| | No dependants but with children aged 15 years or over | *0.4 | *1.0 | *0.8 | 0.7 | 1.6 | 1.3 | |
| Other | | | | | | | |
| | Dependent student | 48.0 | 25.5 | 32.4 | 18.3 | 10.2 | 12.5 | |
| | Non-dependent child | 6.8 | 2.8 | 4.1 | 14.5 | 6.5 | 8.8 | |
| | Other relative | 1.5 | 1.3 | 1.4 | 2.1 | 1.2 | 1.5 | |
| | Non-family member not living alone | 6.4 | 2.1 | 3.4 | 8.5 | 2.8 | 4.5 | |
| | Person living alone | 6.3 | 4.9 | 5.4 | 8.5 | 4.7 | 5.7 | |
| | Relationship not determined | 4.6 | 4.1 | 4.3 | 4.8 | 3.6 | 3.9 | |
| Total | 100.0 | 100.0 | 100.0 | 100.0 | 100.0 | 100.0 | |
Proportion of those usually working 1-7 or 8-34 hours who would prefer to work more hours (%) | |
| |
| Relationship in household(a) | | | | | | | |
| Spouse or partner with | | | | | | | |
| | Children under 15 years | *63.1 | 25.1 | 27.2 | 35.1 | 13.3 | 16.8 | |
| | No children under 15 years, but with dependent students | *44.2 | *34.6 | *37.5 | 35.5 | 15.0 | 18.6 | |
| | No dependants but with children aged 15 years or older | *39.8 | *9.4 | *18.5 | 28.3 | 12.6 | 15.7 | |
| | No children | 26.2 | 22.1 | 23.4 | 25.5 | 19.1 | 21.0 | |
| Single parent with | | | | | | | |
| | Children under 15 years | *100.0 | 51.9 | 54.8 | 45.4 | 28.8 | 30.2 | |
| | No children under 15 years, but with dependent students | * - | *83.1 | *83.1 | *43.9 | 37.0 | 37.4 | |
| | No dependants but with children aged 15 years or over | * - | *25.0 | *21.5 | *41.5 | 31.5 | 33.0 | |
| Other | | | | | | | |
| | Dependent student | 33.6 | 33.2 | 33.4 | 21.5 | 22.7 | 22.2 | |
| | Non-dependent child | 68.5 | 74.1 | 71.2 | 54.1 | 48.2 | 51.0 | |
| | Other relative | *10.1 | *39.7 | *29.9 | 41.7 | 38.6 | 39.9 | |
| | Non-family member not living alone | *55.2 | *28.2 | 43.8 | 31.6 | 32.0 | 31.8 | |
| | Person living alone | *41.1 | 38.2 | 39.2 | 33.2 | 31.5 | 32.2 | |
| | Relationship not determined | *28.2 | *37.0 | 34.1 | 32.1 | 26.4 | 28.4 | |
| |
| * estimate is subject to sampling variability too high for most practical purposes |
| - nil or rounded to zero (including null cells) |
| (a) See Glossary for definitions of relationship in household. |
| Labour Force Survey. |
OCCUPATION
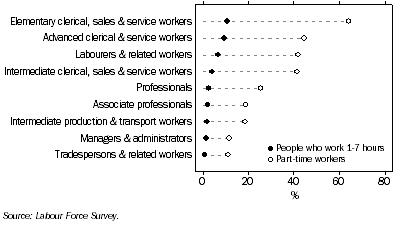
In November 2004, the occupations that had the highest proportions of people working 1-7 hours per week were the clerical, sales and service worker occupations, and labourers and related workers. These were also the occupations with the highest proportions of people working part-time. Generally occupations with a high concentration of people working few hours per week were those which required lower levels of educational qualifications (end note 5). About 11% of people working as elementary clerical, sales and service workers were working 1-7 hours per week, while 64% of people working in this occupation were part-time workers.
7. Proportion of part-time workers in each occupation - Nov 2004
People working 1-7 hours per week were concentrated in the retail trade industry (28% of people working 1-7 hours were in this industry), followed by property and business services (12%) and accommodation, cafes and restaurants (10%).
Older people
While people working few hours were generally concentrated in the clerical, sales and service worker occupations, the main occupations of older people (people aged 55 years or older) working few hours were slightly different. In November 2004, 20% of people aged 55 years or older and working 1-7 hours per week were working as professionals (27% of men; 16% of women). The next most likely occupation for people working few hours in this age group was 'labourers and related workers' (about 14%), followed by advanced clerical and service workers (also 14%).
Older people tended to account for relatively large proportions of those who were working part-time hours in the 'managers and administrators' and 'professionals' occupations. This may be due to the fact that some people take up consultancy jobs after retiring from full-time jobs. In November 2004, the number of people working 1-7 hours as managers and administrators was relatively small (about 10,000 people) and over half (55%) of these people were aged 55 years or older. About 29% of 'professionals' working 1-7 hours were also in this age group.
8. People who usually work 1-7 hours per week(a), By occupation and sex - Nov 2004 |
| |
| | Males
| Females
| Total
| |
| | 15-24 years | 25-54 years | 55 years or older | 15-24 years | 25-54 years | 55 years or older | 15-24 years | 25-54 years | 55 years or older | |
| |
| Occupation (%) | | | | | | | | | | |
| Managers and administrators | * - | *2.8 | *4.8 | *0.1 | *3.1 | *10.6 | *0.1 | 3.1 | 8.4 | |
| Professionals | *2.7 | *19.8 | 26.9 | *3.9 | 18.0 | 15.5 | 3.3 | 18.2 | 19.9 | |
| Associate professionals | *4.7 | *8.6 | *13.8 | *4.2 | 9.5 | *7.3 | 4.4 | 9.4 | 9.8 | |
| Tradespersons and related workers | *1.6 | *12.7 | *7.3 | *0.7 | *2.1 | *3.6 | *1.1 | 3.4 | *5.0 | |
| Advanced clerical and service workers | *0.4 | * - | *6.3 | *0.6 | 18.1 | 19.0 | *0.5 | 15.9 | 14.1 | |
| Intermediate clerical, sales and service workers | 11.6 | *8.5 | *3.5 | 26.3 | 21.6 | 16.8 | 19.8 | 20.0 | 11.6 | |
| Intermediate production and transport workers | 13.1 | *8.5 | *7.9 | *1.7 | *0.8 | *0.4 | 6.7 | *1.8 | *3.4 | |
| Elementary clerical, sales and service workers | 39.3 | *13.4 | *14.6 | 53.5 | 13.4 | 12.7 | 47.2 | 13.4 | 13.5 | |
| Labourers and related workers | 26.7 | 25.7 | *14.9 | 9.1 | 13.3 | 14.0 | 16.8 | 14.9 | 14.3 | |
| Total | 100.0 | 100.0 | 100.0 | 100.0 | 100.0 | 100.0 | 100.0 | 100.0 | 100.0 | |
| People (no.) | 70,699 | 18,011 | 25,640 | 89,372 | 125,906 | 40,013 | 160,070 | 143,917 | 65,653 | |
| |
| * estimate is subject to sampling variability too high for most practical purposes |
| - nil or rounded to zero (including null cells) |
| (a) 1-7 hours per week. |
| Labour Force Survey. |
HOUSEHOLD INCOME
In 2002-03, in 78% of households where a person usually worked 1-7 hours per week, there was at least one other person who was employed.
In about nine out of ten households where there was only one person employed and that person was working few hours, the principal source of income for the household was something other than wages and salaries. In 2002-03 the principal source of income for most of these households (72%) was government pensions and allowances. In contrast, in almost nine out of ten households (86%) where at least one other person was employed, wages and salaries was the principal source of income. Most people who work 1-7 hours are therefore relying on either government pensions and allowances or the wages and salaries of others in the household as their principal source of income.
Table 9 shows equivalised disposable (after tax) household income quintiles for those working few hours in 2002-03. This measure is adjusted to standardise income estimates with respect to household size and composition. In 2002-03, most households (about 82%), where only one person was employed and that person usually worked 1-7 hours per week, were in the bottom two income quintiles.
Households where more than one person was employed, at least one of whom was working 1-7 hours per week, were concentrated in the second, third and fourth disposable household income quintiles. Over one in four (28%) households with more than one person employed and a person working 1-7 hours per week were in the second highest disposable household income quintile.
9. Income quintiles, Households where someone usually works 1-7 hours per week - 2002-03 |
| |
| Equivalised disposable household income quintile
| |
| Lowest | Second | Third | Fourth | Highest | Total | |
| % | % | % | % | % | % | |
| |
| Households where only one person is employed, and that person usually works 1-7 hours per week | 49.3 | 32.5 | *14.7 | **3.5 | - | 100.0 | |
| Households where two or more people are employed, and at least one person usually works 1-7 hours per week | 12.1 | 21.5 | 23.1 | 28.1 | 15.3 | 100.0 | |
| All households | 24.3 | 18.3 | 17.9 | 18.4 | 21.0 | 100.0 | |
| |
| * estimate has a relative standard error of 25% to 50% and should be used with caution |
| ** estimate has a relative standard error greater than 50% and is considered too unreliable for general use |
| - nil or rounded to zero (including null cells) |
| Survey of Income and Housing Costs, 2002-2003. |
FURTHER INFORMATION
For further information about statistics on people working less than 35 hours per week in Australia, please contact the Assistant Director, Labour Supply on Canberra (02) 6252 6562.
For email enquiries please contact Client Services on client.services@abs.gov.au
END NOTES
1. People employed part-time are those employed people who usually worked less than 35 hours a week in all jobs and either did so during the reference week, or were not at work in the reference week. For the purposes of this article, all people who usually worked less than 35 hours a week are considered to be part-time, even if they worked more than 35 hours a week in the reference period. < Back
2. These data come from the Underemployed Workers Survey, not the Labour Force Survey, and therefore have a different reference period to the rest of the data in this article. < Back
3. Dependent students are those who are 15-24 years of age, attending full-time education, and have no partner or child of their own usually resident in the same household. < Back
4. A non-dependent child is a child of a couple or lone parent usually resident in the household, aged over 15 years and who is not a dependent student aged 15-24 years, and who has no partner or child of their own usually resident in the household. < Back
5. See the Australian Standard Classification of Occupations, Second Edition (cat. no. 1220.0) for information about the skill levels required for different occupations. < Back
 Print Page
 Print All