EXPORT AND IMPORT INVOICE CURRENCIES, DEC 2007
INTRODUCTION
Goods imported into and exported from Australia can be invoiced in a range of currencies. This article analyses the major currencies used in these invoices. In particular, this article looks at:
- Compositional changes in the currencies used to invoice goods imported into and exported from Australia for the five quarters from December quarter 2006 to December quarter 2007.
- The currencies used to invoice imports into and exports from Australia by selected divisions of the Standard International Trade Classification Revision 3 (SITC Rev 3).
- Comparisons of the currencies used to invoice merchandise trade from the 2004 calendar year through to the 2007 calendar year.
Similar analyses appeared in the March quarter 1998, March quarter 2001 and March quarter 2003 issues of the discontinued publication,
International Merchandise Trade, Australia (cat. no. 5422.0). The last analysis, in respect of March quarter 2005, appeared as a feature article in the June 2005 release of
International Trade in Goods and Services, Australia (cat. no. 5368.0).
All values in this article are reported in Australian dollars. Details about the measurement of invoice currencies are provided as an appendix to this article.
EXCHANGE RATES
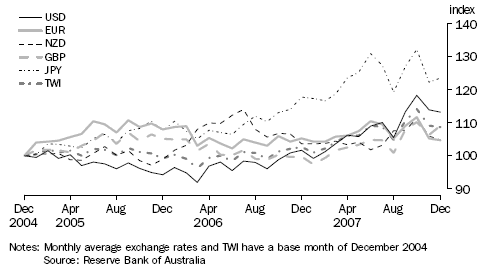
Graph 1 shows movements in the value of the Australian dollar against selected currencies and the movement in the Trade Weighted Index (TWI) from December 2004 to December 2007. The graph shows that the Australian dollar has appreciated substantially against the currencies of most of Australia's major trading partners over this period, particularly against the Japanese yen.
Over this period the Australian dollar appreciated against:
- the Japanese yen (JPY) by 23%
- the United States dollar (USD) by 13%
- the United Kingdom pound sterling (GBP) by 9%
- the New Zealand dollar (NZD) by 5%
- the Euro (EUR) by 5%.
There has been an overall rise in the TWI of 9% between December 2004 and December 2007.
GRAPH 1. MOVEMENTS IN SELECTED EXCHANGE RATES
With an appreciating Australian dollar, Australian exports invoiced in Australian dollars provide greater returns to the exporters but, all other things being equal, the exports become less attractive to foreign buyers as it takes more of their currency to purchase Australian goods. In contrast, Australian exports invoiced in other currencies provide smaller Australian dollar returns to exporters and decrease the nominal value of Australian exports. From the import perspective, an appreciating Australian dollar makes imports invoiced in other currencies more attractive to domestic consumers as their purchase requires fewer Australian dollars.
For the purpose of producing Australian import and export statistics, foreign currencies are converted to the Australian dollar using the exchange rate applicable on the day of shipment. However, these statistics may differ from actual payments as trading partners may undertake the conversion for payment purposes using a different exchange rate or one applying on a different day. In addition, some exporters and importers hedge exchange rates and calculate the value of the transaction using the hedged exchange rate rather than the prevailing exchange rate.
A feature article, "The Terms of Trade and the National Accounts", released with the December quarter 2004 issue of National Income, Expenditure and Product, Australia (cat. no. 5206.0) discusses, amongst other things, how exchange rates can influence the terms of trade.
EXPORT CURRENCIES
Table 1 lists the major currencies used to invoice Australian exports of merchandise goods during a five quarter period, beginning December quarter 2006 and ending December quarter 2007.
TABLE 1. INVOICE CURRENCIES FOR EXPORTS |
|  |
| Invoice currency | Dec Qtr 2006 | Mar Qtr 2007 | Jun Qtr 2007 | Sep Qtr 2007 | Dec Qtr 2007 | |
VALUE ($m) | |
| |
| USD | 32 577 | 30 171 | 32 044 | 31 964 | 31 946 | |
| AUD | 9 075 | 8 311 | 8 955 | 9 144 | 9 529 | |
| EUR | 451 | 349 | 408 | 381 | 421 | |
| NZD | 402 | 354 | 403 | 431 | 453 | |
| GBP | 298 | 329 | 355 | 385 | 322 | |
| JPY | 327 | 182 | 171 | 360 | 221 | |
| Other | 110 | 111 | 104 | 137 | 128 | |
| Total | 43 239 | 39 806 | 42 439 | 42 802 | 43 020 | |
CONTRIBUTION (%) | |
| |
| USD | 75.3 | 75.8 | 75.5 | 74.7 | 74.3 | |
| AUD | 21.0 | 20.9 | 21.1 | 21.4 | 22.2 | |
| EUR | 1.0 | 0.9 | 1.0 | 0.9 | 1.0 | |
| NZD | 0.9 | 0.9 | 0.9 | 1.0 | 1.1 | |
| GBP | 0.7 | 0.8 | 0.8 | 0.9 | 0.7 | |
| JPY | 0.8 | 0.5 | 0.4 | 0.8 | 0.5 | |
| Other | 0.3 | 0.3 | 0.2 | 0.3 | 0.3 | |
| Total | 100.0 | 100.0 | 100.0 | 100.0 | 100.0 | |
| |
During this period, approximately 75% of Australia's merchandise exports were invoiced in United States dollars. Merchandise exports invoiced in Australian dollars accounted for about 21% of exports. The percentage contributions of both the United States dollar and Australian dollar remained relatively steady across the five quarters. About 1% of Australia's merchandise exports were invoiced in each of the Euro, New Zealand dollar, United Kingdom pound sterling and Japanese yen.
The group of currencies classified as "Other" in the above table in total accounted for approximately 0.3% of Australian merchandise exports over this period. The main currencies in this '"Other" group include the Singapore dollar, Hong Kong dollar and Thai baht.
EXPORT COMMODITIES
Table 2 lists the major currencies used to invoice Australian exports by selected SITC Rev 3 divisions (2 digit) for the 2007 calendar year.
TABLE 2. EXPORT INVOICE CURRENCIES FOR SELECTED SITC Rev 3 DIVISONS(a), Percentage Contributions - For calendar year 2007 |
| |
| Value | USD | AUD | EUR | NZD | GBP | JPY | Other | |
| SITC code description | ($m) | (%) | (%) | (%) | (%) | (%) | (%) | (%) | |
| |
| 28 Metalliferous ores and metal scrap | 35 330 | 95.3 | 4.7 | - | - | - | - | - | |
| 32 Coal, coke and briquettes | 20 878 | 94.3 | 5.6 | - | - | - | - | - | |
| 68 Non-ferrous metals | 13 648 | 93.4 | 6.5 | - | - | - | - | - | |
| 97 Gold, non-monetary (excl. gold ores and concentrates) | 11 344 | 98.9 | 1.1 | - | - | - | - | - | |
| 33 Petroleum, petroleum products and related materials | 11 183 | 85.8 | 14.1 | - | - | - | - | - | |
| 01 Meat and meat preparations | 6 630 | 51.5 | 42.9 | 0.7 | 0.4 | 0.9 | 2.9 | 0.7 | |
| 34 Gas, natural and manufactured | 6 123 | 82.1 | 17.9 | - | - | - | - | - | |
| 78 Road vehicles (incl. air-cushion vehicles) | 4 072 | 63.3 | 24.8 | 0.6 | 10.6 | 0.6 | 0.1 | - | |
| 54 Medicinal and pharmaceutical products | 3 934 | 9.3 | 77.9 | 2.3 | 3.5 | 4.9 | 0.4 | 1.7 | |
| 04 Cereals and cereal preparations | 3 365 | 85.5 | 13.2 | 0.1 | 0.2 | 0.1 | 0.6 | 0.2 | |
| 26 Textile fibres and their wastes (not manufactured into yarn or fabric) | 3 341 | 57.7 | 38.5 | 3.3 | - | 0.3 | 0.1 | - | |
| 11 Beverages | 3 101 | 5.0 | 71.7 | 2.0 | 1.9 | 16.9 | 0.2 | 2.3 | |
| 02 Dairy products and birds' eggs | 2 439 | 74.3 | 24.2 | 0.3 | - | 0.2 | 1.0 | - | |
| 89 Miscellaneous manufactured articles, n.e.s. | 2 353 | 21.8 | 58.0 | 2.7 | 6.9 | 8.1 | 0.4 | 2.0 | |
| 77 Electrical machinery, apparatus, appliances, parts (incl. non-electrical counterparts of electrical domestic equipment) | 1 857 | 30.3 | 58.3 | 5.5 | 2.1 | 3.2 | 0.2 | 0.4 | |
| 87 Professional, scientific and controlling instruments and apparatus, n.e.s. | 1 810 | 42.0 | 37.4 | 11.4 | 2.5 | 3.2 | 1.2 | 2.2 | |
| 72 Machinery specialised for particular industries | 1 719 | 24.6 | 69.2 | 3.2 | 1.4 | 0.9 | - | 0.6 | |
| 74 General industrial machinery and equipment, n.e.s. and machine parts, n.e.s. | 1 665 | 20.5 | 73.3 | 2.6 | 1.0 | 1.9 | 0.2 | 0.4 | |
| 93 Special transactions and commodities not classified according to kind | 1 350 | 30.1 | 61.5 | 0.5 | 7.0 | 0.2 | 0.1 | 0.6 | |
| 05 Vegetables and fruit | 1 291 | 35.5 | 59.0 | 1.0 | 1.7 | 0.6 | 1.5 | 0.7 | |
| Other | 30 633 | 57.4 | 35.3 | 2.3 | 1.9 | 0.6 | 2.0 | 0.5 | |
| Total | 168 067 | 75.0 | 21.4 | 0.9 | 1.0 | 0.8 | 0.6 | 0.3 | |
| |
| - nil or rounded to zero (including null cells) |
| (a) Some SITC sections and division exclude commodities subject to a confidentiality restriction. These are included in Other. |
Nine of the 10 largest commodity groups exported during 2007 were primarily invoiced in United States dollars. Of these, the four largest commodity groups had over 90% of their value invoiced in United States dollars, namely:
- 99% of exports of gold, non-monetary (excl. gold ores and concentrates) (SITC 97)
- 95% of exports of metalliferous ores and metal scrap (SITC 28)
- 94% of exports of coal, coke and briquettes (SITC 32)
- 93% of exports of non-ferrous metals (SITC 68).
Eight of the 20 largest export commodity groups were primarily invoiced in Australian dollars with the largest being:
- 78% of exports of medicinal and pharmaceutical products (SITC 54)
- 73% of exports of general industrial machinery and equipment, n.e.s and machine parts (SITC 74)
- 72% of exports of beverages (SITC 11).
IMPORT CURRENCIES
Table 3 lists the major currencies used to invoice Australian imports of merchandise goods during a five quarter period, beginning December quarter 2006 and ending December quarter 2007.
TABLE 3. INVOICE CURRENCIES FOR IMPORTS |
| |
| Invoice currency | Dec Qtr 2006 | Mar Qtr 2007 | Jun Qtr 2007 | Sep Qtr 2007 | Dec Qtr 2007 | |
VALUE ($ million) | |
| |
| USD | 23 977 | 21 920 | 23 446 | 24 596 | 26 207 | |
| AUD | 15 565 | 15 322 | 15 516 | 15 907 | 17 083 | |
| EUR | 4 025 | 3 829 | 3 800 | 3 871 | 4 094 | |
| NZD | 506 | 424 | 464 | 499 | 535 | |
| GBP | 668 | 741 | 689 | 698 | 701 | |
| JPY | 1 013 | 942 | 919 | 937 | 962 | |
| Other | 926 | 831 | 830 | 1 158 | 847 | |
| Total | 46 678 | 44 008 | 45 663 | 47 666 | 50 429 | |
CONTRIBUTION (%) | |
| |
| USD | 51.4 | 49.8 | 51.3 | 51.6 | 52.0 | |
| AUD | 33.3 | 34.8 | 34.0 | 33.4 | 33.9 | |
| EUR | 8.6 | 8.7 | 8.3 | 8.1 | 8.1 | |
| NZD | 1.1 | 1.0 | 1.0 | 1.0 | 1.1 | |
| GBP | 1.4 | 1.7 | 1.5 | 1.5 | 1.4 | |
| JPY | 2.2 | 2.1 | 2.0 | 2.0 | 1.9 | |
| Other | 2.0 | 1.9 | 1.8 | 2.4 | 1.7 | |
| Total | 100.0 | 100.0 | 100.0 | 100.0 | 100.0 | |
| |
During this period, approximately 51% of Australia's merchandise imports were invoiced in United States dollars, 34% were invoiced in Australian dollars with the Euro (8%) the next largest currency. Percentage contributions of the United States dollar, Australian dollar and Euro remained relatively steady across the quarters.
The group of currencies classified as "Other" in the above table in total accounted for about 2% of Australian merchandise imports. The main currencies in this "Other" group include the Singapore dollar, Hong Kong dollar and Thai baht which were the same main currencies in the "Other" group for exports.
IMPORT COMMODITIES
Table 4 lists the major currencies used to invoice Australian imports by selected SITC Rev 3 divisions (2 digit) for the 2007 calendar year.
TABLE 4. IMPORT INVOICE CURRENCIES FOR SELECTED SITC Rev 3 DIVISIONS(a), Percentage Contributions - For calendar year 2007 |
| |
| Value | USD | AUD | EUR | NZD | GBP | JPY | Other | |
| SITC code description | ($m) | (%) | (%) | (%) | (%) | (%) | (%) | (%) | |
| |
| 78 Road vehicles (incl. air-cushion vehicles) | 24 310 | 12.9 | 74.7 | 7.2 | 0.2 | 0.6 | 4.1 | 0.3 | |
| 33 Petroleum, petroleum products and related materials | 23 316 | 99.7 | 0.2 | 0.1 | - | - | - | - | |
| 76 Telecommunications and sound recording and reproducing apparatus and equipment | 10 214 | 39.9 | 52.6 | 2.9 | 0.3 | 1.0 | 2.9 | 0.5 | |
| 74 General industrial machinery and equipment, n.e.s. and machine parts, n.e.s. | 9 923 | 37.7 | 30.1 | 21.8 | 1.0 | 2.0 | 4.1 | 3.4 | |
| 75 Office machines and automatic data processing machines | 9 669 | 71.8 | 22.5 | 1.5 | 0.3 | 0.6 | 2.5 | 0.8 | |
| 89 Miscellaneous manufactured articles, n.e.s. | 9 441 | 40.8 | 40.2 | 8.4 | 1.7 | 3.9 | 1.1 | 4.0 | |
| 77 Electrical machinery, apparatus, appliances, parts (incl. non-electrical counterparts of electrical domestic equipment | 8 990 | 48.6 | 32.4 | 12.1 | 0.8 | 2.4 | 1.3 | 2.4 | |
| 54 Medicinal and pharmaceutical products | 7 981 | 13.4 | 79.8 | 3.9 | 0.4 | 1.5 | 0.1 | 1.0 | |
| 72 Machinery specialised for particular industries | 7 091 | 37.4 | 21.3 | 24.2 | 0.9 | 4.2 | 8.9 | 3.2 | |
| 97 Gold, non-monetary (excl. gold ores and concentrates) | 6 128 | 89.6 | 1.6 | 0.1 | 3.7 | - | - | 5.0 | |
| 69 Manufactures of metals, n.e.s. | 4 695 | 52.8 | 26.4 | 13.5 | 1.2 | 1.6 | 0.9 | 3.5 | |
| 84 Articles of apparel and clothing accessories | 4 467 | 65.3 | 23.2 | 3.4 | 1.1 | 0.6 | 0.2 | 6.3 | |
| 87 Professional,scientific and controlling instruments and apparatus, n.e.s. | 4 224 | 40.4 | 33.7 | 15.2 | 0.9 | 4.4 | 1.9 | 3.6 | |
| 79 Transport equipment (excl. road vehicles) | 4 181 | 70.6 | 15.0 | 8.0 | 0.7 | 4.2 | 0.1 | 1.4 | |
| 71 Power generating machinery and equipment | 3 952 | 45.9 | 23.3 | 17.1 | 0.7 | 3.6 | 4.1 | 5.3 | |
| 67 Iron and steel | 3 773 | 66.2 | 25.0 | 5.4 | 0.3 | 0.8 | 1.6 | 0.7 | |
| 51 Organic materials | 3 381 | 42.7 | 52.9 | 2.8 | 0.1 | 0.9 | 0.4 | 0.2 | |
| 64 Paper, paperboard, and articles of paper pulp, of paper or of paperboard | 2 752 | 31.9 | 52.0 | 8.7 | 4.4 | 0.5 | 0.4 | 2.1 | |
| 65 Textiles yarn, fabrics, made up articles n.e.s. and related products | 2 474 | 62.7 | 19.4 | 10.7 | 3.5 | 1.7 | 0.9 | 1.2 | |
| 62 Rubber manufactures, n.e.s. | 2 462 | 36.2 | 50.3 | 7.8 | 0.3 | 0.8 | 3.6 | 1.1 | |
| Other | 34 342 | 53.8 | 27.0 | 11.3 | 2.1 | 1.8 | 1.4 | 2.6 | |
| Total | 187 765 | 51.2 | 34.0 | 8.3 | 1.0 | 1.5 | 2.0 | 2.0 | |
| |
| - nil or rounded to zero (including null cells) |
| (a) Some SITC sections and division exclude commodities subject to a confidentiality restriction. These are included in Other. |
The United States dollar was the currency most used in invoices for the majority of the above SITC commodity groupings. Almost 100% of imports of petroleum, petroleum products and related materials (SITC 33), 90% of gold, non-monetary (excl. gold ores and concentrates) (SITC 97) and 72% of imports of office machines and automatic data processing machines (SITC 75) were invoiced in United States dollars.
For a small number of commodity groups the Australian dollar was the most used import invoice currency. Invoicing in Australian dollars accounted for 75% of imports of road vehicles (incl.air cushion vehicles) (SITC 78), 80% of medicinal and pharmaceutical products (SITC 54), 53% of organic materials (SITC 51) and 53% of telecommunications and sound recording and reproducing apparatus and equipment (SITC 76).
The Euro was the third most significant import invoice currency accounting for 24% of machinery specialised for particular industries (SITC 72), 22% of imports of general industrial machinery and equipment n.e.s. and machine parts, n.e.s. (SITC 74) and 17% of imports of power generating machinery and equipment (SITC 71).
RECENT YEARS COMPARISON
Table 5 shows the proportion of exports and imports invoiced in the major currencies in the last four calendar years from 2004 to 2007.
TABLE 5: EXPORTS AND IMPORTS |
| |
| 2004 | 2005 | 2006 | 2007 | |
| Invoice currency | % | % | % | % | |
EXPORTS | |
| |
| USD | 69.4 | 72.6 | 75.4 | 75.0 | |
| AUD | 26.2 | 23.5 | 21.1 | 21.4 | |
| EUR | 1.3 | 1.1 | 1.0 | 0.9 | |
| NZD | 1.2 | 1.1 | 0.8 | 1.0 | |
| GBP | 1.0 | 0.8 | 0.7 | 0.8 | |
| JPY | 0.8 | 0.7 | 0.7 | 0.6 | |
| Other | 0.1 | 0.3 | 0.3 | 0.3 | |
| Total | 100.0 | 100.0 | 100.0 | 100.0 | |
| Total exports ($m) | 117 887 | 139 079 | 163 754 | 168 067 | |
IMPORTS | |
| |
| USD | 49.8 | 51.6 | 52.9 | 51.2 | |
| AUD | 32.1 | 31.7 | 32.1 | 34.0 | |
| EUR | 9.1 | 8.9 | 8.2 | 8.3 | |
| NZD | 1.3 | 1.2 | 1.1 | 1.0 | |
| GBP | 1.9 | 1.7 | 1.4 | 1.5 | |
| JPY | 2.8 | 2.6 | 2.3 | 2.0 | |
| Other | 3.0 | 2.4 | 2.0 | 2.0 | |
| Total | 100.0 | 100.0 | 100.0 | 100.0 | |
| Total Imports ($m) | 141 247 | 155 729 | 176 090 | 187 765 | |
| |
The proportion of merchandise exports invoiced in United States dollars increased steadily from 69% in 2004 to 75% in both 2006 and 2007. The main offset to this increase was a decrease in exports invoiced in Australian dollars from 26% in 2004 to 21% in both 2006 and 2007. The proportion of exports invoiced in other currencies remained relatively constant over the four year period. In 2007, approximately 1% of Australia's merchandise exports were invoiced in each of the Euro, United Kingdom pound sterling, Japanese yen and New Zealand dollar. The group of currencies classified as "Other" accounted for less than 1% of Australian merchandise exports.
The proportion of imports invoiced in United States dollars increased slightly from 50% in 2004 to 51% in 2007 with a peak of 53% in 2006, while those invoiced in Australian dollars grew from 32% in 2004 to 34% in 2007. The proportion of imports invoiced in each of the other currencies decreased slightly over the four year period. In 2007 approximately 8% of Australia's merchandise imports were invoiced in the Euro, 2% were invoiced in each of the United Kingdom pound sterling and Japanese yen, and 1% in the New Zealand dollar. The group of currencies classified as "Other" accounted for 2% of Australian merchandise imports.
ABBREVIATIONS
| $m | million Australian dollars |
| ABS | Australian Bureau of Statistics |
| excl. | excluding |
| GBP | United Kingdom pound sterling |
| JPY | Japanese yen |
| n.e.s. | not elsewhere specified |
| NZD | New Zealand dollar |
| SITC Rev 3 | Standard International Trade Classification Revision 3 |
| TWI | Trade Weighted Index |
| USD | United States dollar |
APPENDIX
MEASUREMENT of INVOICE CURRENCIES
Information on the invoice currencies used in export and import transactions is collected by the Australian Customs Service (Customs) and passed to the ABS with other merchandise trade information required for statistical purposes.
For exports, the ABS converts values reported in foreign currencies to Australian dollars using a representative mid-point of the buy and sell rates on the date of departure of the goods from Australia.
For imports, Customs converts values reported in foreign currencies to Australian dollars using exchange rates applicable on the date of departure of the goods from the overseas country. The ABS receives details of the invoice currency together with the value of the import transaction in Australian dollars.
For the purpose of Australian import and export statistics, foreign currencies are converted to the Australian dollar using the exchange rate applicable on the date of shipment. However, trading partners may undertake the conversion for payment purposes using a different exchange rate or one applying on a different day. In addition, some exporters and importers hedge exchange rates and calculate the value of the transaction using the hedged exchange rate rather than the prevailing exchange rate. For more information about hedging activity undertaken by importers and exporters in 2005, refer to Foreign Currency Exposure, Australia, March 2005 (cat. no. 5308.0)
For exports prior to October 2004, Customs only permitted goods to be invoiced in a relatively small number of currencies. In October 2004, the range of currencies allowed on export documents was increased to 28. As transactions in non-permitted currencies are converted to Australian dollars by the exporter, the increase in the number of permitted currencies may have reduced the proportion of export invoices reported in Australian dollars for December quarter 2004 and following quarters.
 Print Page
 Print All