Price indexes and contract price indexation
SEPTEMBER QUARTER KEY FIGURES
 | Jun Qtr 05 to Sep Qtr 05 | Sep Qtr 04 to Sep Qtr 05 |
| STAGE OF PRODUCTION | % change | % change |
|
| Final (Stage 3) commodities (excl. exports) | 1.5 | 3.4 |
| Domestic | 1.4 | 4.6 |
| Imports | 1.2 | -3.0 |
| Intermediate (Stage 2) commodities | 2.5 | 4.9 |
| Domestic | 2.3 | 5.0 |
| Imports | 3.2 | 3.8 |
| Preliminary (Stage 1) commodities | 3.4 | 6.5 |
| Domestic | 3.2 | 6.0 |
| Imports | 4.7 | 9.2 |
|
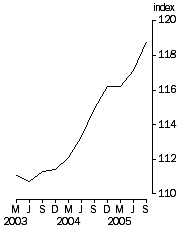
Final Stage, Base: 1998-99 = 100.0
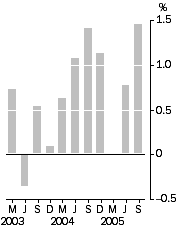
| Final Stage, Quarterly % change
|
SEPTEMBER QUARTER KEY POINTS
FINAL (STAGE 3) COMMODITIES
- The final (Stage 3) index rose 1.5% in the September quarter 2005.
- The domestic component rose 1.4%, mainly due to increases in building construction and petroleum refining. These increases were partially offset by decreases in meat and meat product manufacturing.
- The imports component rose 1.2%, due to price increases for consumption goods, including petroleum refining and tobacco product manufacturing.
INTERMEDIATE (STAGE 2) COMMODITIES
- The intermediate (Stage 2) index rose 2.5% in the September quarter 2005.
- The domestic component rose 2.3%, mainly due to increases in coal mining, oil and gas extraction and petroleum refining. These increases were partially offset by decreases in basic chemical manufacturing and meat and meat product manufacturing.
- The imports component rose 3.2%, due to oil and gas extraction and petroleum refining. These increases were partially offset by decreases in basic chemical manufacturing.
PRELIMINARY (STAGE 1) COMMODITIES
- The preliminary (Stage 1) index rose 3.4% in the September quarter 2005.
- The domestic component rose 3.2% mainly due to coal mining, oil and gas extraction and petroleum refining. These increases were partially offset by decreases in basic chemical manufacturing.
- The imports component rose 4.7%, due to oil and gas extraction and petroleum refining. These increases were partially offset by decreases in basic chemical manufacturing.
NOTES
CHANGES IN THIS ISSUE
A new price index, the Price Index of Materials Used in Building Other Than House Building, Special Series, Perth, is released for the first time this quarter. It is published as Table 48, available on the ABS website <www.abs.gov.au>. Details of this series are provided in Appendix 1.
CHANGES IN NEXT ISSUE
The Price Index of Materials Used in House Building will be reweighted in December quarter 2005. Details of this reweighting process, including the new weighting pattern, are provided in Appendix 2.
From December quarter 2005, the Price Index of Output of the General Construction Industry (Table 16) will be available on a state basis, in addition to the current national measure. Historical series of state price indexes for constituent groups and classes of the General Construction subdivision will also be available on request.
RELATED STATISTICS
For more information about statistics in this publication and about other 'ABS data available on request', contact Steve Whennan on Canberra (02) 6252 6251, or email <steve.whennan@abs.gov.au>.
INQUIRIES
For further information about these and related statistics, contact the National Information and Referral Service on 1300 135 070 or Steve Whennan on Canberra (02) 6252 6251.
COMMENTARY
STAGE OF PRODUCTION OVERVIEW
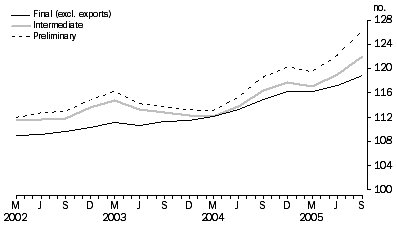
Each of the three stage of production indexes increased in the September quarter 2005, with the preliminary (Stage 1) index showing the largest rise of 3.4%, followed by an increase of 2.5% for the intermediate (Stage 2) index, and an increase of 1.5% for the final (Stage 3) index. Through the year to September quarter 2005, the preliminary (Stage 1) index increased by 6.5%, followed by an increase of 4.9% for the intermediate (Stage 2) index and an increase of 3.4% for the final (Stage 3) index.
The increase of 1.5% in the final (Stage 3) index reflects an increase of 1.4% in the price of domestically produced items and an increase of 1.2% in the price of imported items. The domestic component increased due to price rises for building construction and petroleum refining, which were partially offset by decreases in meat and meat product manufacturing. The imports component increased due to price rises for petroleum refining, tobacco product manufacturing and other transport equipment.
The increase of 2.5% in the intermediate (Stage 2) index reflects an increase of 2.3% in the price of domestically produced items and an increase of 3.2% in the price of imported items. The domestic component increased due to price rises for coal mining, oil and gas extraction and petroleum refining, which were partially offset by price decreases for basic chemical manufacturing and meat and meat product manufacturing. The imports component increased due to price rises for oil and gas extraction and petroleum refining, which were partially offset by price falls for basic chemical manufacturing.
The increase of 3.4% in the preliminary (Stage 1) index reflects an increase of 3.2% in the price of domestically produced items and an increase of 4.7% in the price of imported items. The domestic component increased due to price rises for coal mining, oil and gas extraction and petroleum refining, which were partially offset by price decreases for basic chemical manufacturing. The imports component increased due to price rises for oil and gas extraction and petroleum refining, which were partially offset by price falls for basic chemical manufacturing.
COMPARISON OF SOP INDEXES: Base: 1998-99 = 100.0
MANUFACTURING INDUSTRIES PRODUCER PRICE INDEXES
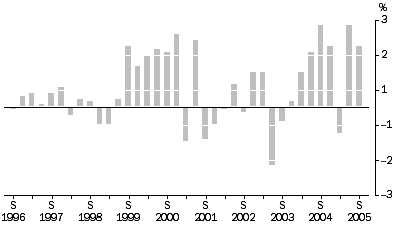
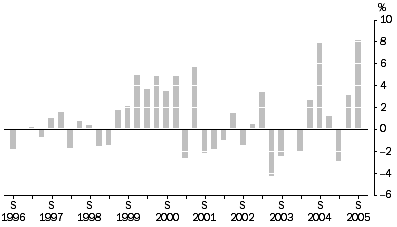
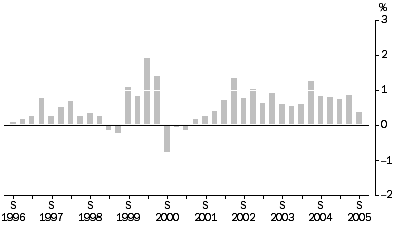
During the September quarter 2005, the prices paid by manufacturers for their material inputs increased by 8.1%, while the prices they received for their outputs increased by 2.1%. The input price index increased by 9.3% through the year to September quarter 2005 and the output price index increased by 6.2% during the same period.
Increases in the price of crude oil (both domestic and imported), iron ore, cattle and calves, coal, and sheep and lambs were the main contributors to the quarterly result for the materials used in manufacturing industries index. Price decreases for imported iron and steel provided some offset to these increases.
Higher prices for leaded and unleaded petroleum, diesel and kerosene contributed to the bulk of the increase in the articles produced by manufacturing industries index for the September quarter 2005. These increases were partially offset by decreases in the prices for beef for both the export market and domestic consumption, alumina, steel and nickel.
Articles Produced By Manufacturing Industries: All Groups, Quarterly % change
 Materials Used In Manufacturing Industries: All Groups, Quarterly % change
CONSTRUCTION INDUSTRIES PRODUCER PRICE INDEXES
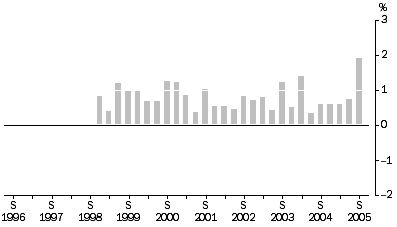
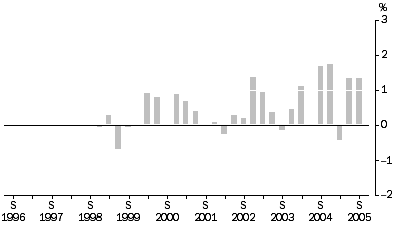
The price indexes for materials used in house building increased by 0.4% in the September quarter 2005, reflecting price increases for a range of materials. The most significant contributors to the increase were clay bricks, aluminium windows and doors, and metal roofing and guttering. The largest offsetting price decrease was recorded for plastic pipes and fittings. Increases were recorded in all state capitals, ranging from 0.2% in Sydney to 1.0% in Hobart.
Through the year to September quarter 2005, the materials used in house building index rose 2.8%.
Materials Used in House Building: All Groups, Quarterly % change
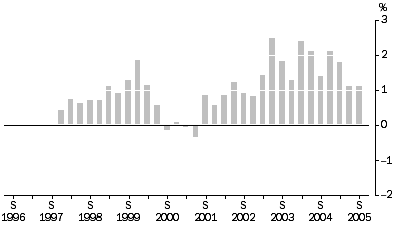
The price index for the output of the general construction industry increased by 1.1% in the September quarter 2005 and by 6.2% through the year to September quarter 2005. Increases were registered in the quarter for all component industries, with the index for house construction being the largest contributor, followed by non-residential building construction, road and bridge construction, and non-house residential building construction.
Contributing to the movement in the general construction industry price indexes this quarter were increases in the cost of material and labour inputs. Of the material inputs, the increasing costs of fuel had the largest impact.
Output of The General Construction Industry: All Groups, Quarterly % change
SERVICE INDUSTRIES PRODUCER PRICE INDEXES
The property and business services industries price index increased by 1.9% in the September quarter 2005 and by 3.9% through the year to September quarter 2005. The property services price index increased by 1.5% this quarter with increases for real estate residential sales fees and commercial property operators. Through the year to September quarter 2005, the property services index rose 4.4%.
Property and Business Services Industries: All Groups, Quarterly % change
The business services index rose 2.1% in the September quarter 2005 and by 3.4% through the year to September quarter 2005. The main contributors to the increase were legal services and consultant engineering services.
The transport (freight) and storage industries index increased by 1.3% in the September quarter 2005. The most significant contributors with price increases were international air freight, refrigerated road freight, general road freight, car-carrying road freight, bulk rail freight and express road freight. The most significant contributor with a price decrease was bulk shipping transport. Through the year to September quarter 2005 the transport (freight) and storage industries index rose by 4.0%.
Transport (Freight) And Storage Industries: All Groups, Quarterly % change
 Print Page
 Print All