08/09/2008 Note: Due to technical problems, we are replacing three incomplete datacubes that were released on the 02/09/2008.
JULY KEY FIGURES
 | | Jul 08 | Jun 08 to Jul 08 | Jul 07 to Jul 08 |
| | no. | % change | % change |
|
| TREND | | | |
| Total dwelling units approved | 12 708 | -0.6 | -3.1 |
| Private sector houses | 8 488 | -1.2 | -4.4 |
| Private sector other dwellings | 3 932 | 0.6 | 2.4 |
| SEASONALLY ADJUSTED | | | |
| Total dwelling units approved | 12 620 | -2.3 | -3.7 |
| Private sector houses | 8 366 | -3.4 | -5.2 |
| Private sector other dwellings | 3 914 | -2.3 | 3.2 |
|
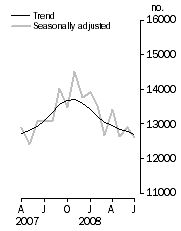
Dwelling units approved
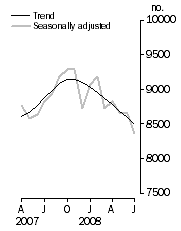
| Private sector houses approved
|
JULY KEY POINTS
TOTAL DWELLING UNITS
- The trend estimate for total dwelling units approved fell 0.6% in July 2008 following a revised fall of 0.5% in June 2008.
- The seasonally adjusted estimate for total dwelling units approved fell 2.3% in July following a revised rise of 2.2% in June.
PRIVATE SECTOR HOUSES
- The trend estimate for private sector houses approved fell 1.2% in July.
- The seasonally adjusted estimate for private sector houses approved fell 3.4% in July following a revised fall of 0.1% in June.
PRIVATE SECTOR OTHER DWELLING UNITS
- The trend estimate for private sector other dwellings approved rose 0.6% in July following a revised increase of 0.7% in June.
- The seasonally adjusted estimate for private sector other dwellings approved fell 2.3% in July following a revised increase of 9.1% in June.
VALUE OF BUILDING APPROVED
- The trend estimate for the value of total building approved rose 0.9% in July. The trend estimate for the value of new residential building approved fell 0.4%, and the value of alterations and additions rose 0.5%. The value of non-residential building approved rose 2.6%.
- The seasonally adjusted estimate for the value of total building approved rose 4.9% in July. The seasonally adjusted estimate for the value of new residential building approved fell 1.7% in July. The seasonally adjusted estimate for the value of alterations and additions rose 5.9%, and the value of non-residential building rose 12.1%.
NOTES
FORTHCOMING ISSUES
| ISSUE | Release Date |
| August 2008 | 30 September 2008 |
| September 2008 | 5 November 2008 |
| October 2008 | 4 December 2008 |
| November 2008 | 8 January 2009 |
| December 2008 | 4 February 2009 |
| January 2009 | 5 March 2009 |
CHANGES IN THIS ISSUE
There are no changes in this issue.
REVISIONS THIS MONTH
Revisions to the total number of dwelling units approved in this issue are:
| 2006-07 | 2007-08 | TOTAL |
|
| NSW | - | 627 | 627 |
| Vic. | - | 2 | 2 |
| Qld | - | 119 | 119 |
| SA | 12 | 148 | 160 |
| WA | - | 1 114 | 1 114 |
| Tas. | - | 6 | 6 |
| NT | - | - | - |
| ACT | - | - | - |
| Total | 12 | 2 016 | 2 028 |
|
Revisions to the estimate of the number dwelling units approved in New South Wales and Western Australia are the result of the receipt of late data. These revisions have not affected the strength or direction of the trend.
There have also been revisions to the value of building approved spread over two financial years. The largest revisions were in New South Wales and Western Australia. These revisions did not affect the direction of the trend but the they have raised the level of the estimate.
DATA NOTES
A special article on 'Average Quarterly Completion Times for New Houses' completed between January 1987 and March 2008 is included in this issue (see page 7).
INQUIRIES
For further information about these and related statistics, contact the National Information and Referral Service on 1300 135 070 or Paul Pamment on Adelaide (08) 8237 7648.
 Quality Declaration
  Print Page
 Print All