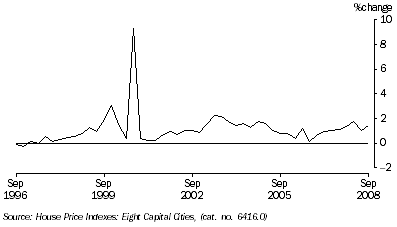
HOUSE PRICE INDEX (HPI)
Project House Price Indexes, (from Table 5.7)

Selected Housing Price and related Indexes(a), Original |
|  |
| Period | Established Homes | Project Homes | Materials used in house building(b) | Total hourly rates of pay excluding bonuses, construction industry | National accounts private housing investment |  |
Annual |  |
|  |
| 2005-06 | 105.1 | 110.3 | 105.8 | 110.3 | 110.6 |  |
| 2006-07 | 115.5 | 113.3 | 109.5 | 115.5 | 114.3 |  |
| 2007-08 | p129.2 | 118.8 | 113.3 | 120.8 | 120.1 |  |
Percentage change from previous year |  |
|  |
| 2005-06 | 3.8 | 4.0 | 2.3 | 4.9 | 4.5 |  |
| 2006-07 | 9.9 | 2.7 | 3.5 | 4.7 | 3.4 |  |
| 2007-08 | p11.9 | 4.8 | 3.4 | 4.6 | 5.0 |  |
Quarterly |  |
|  |
| 2006-2007 |  |  |  |  |  |  |
 | September | 112.0 | 111.9 | 108.5 | 113.5 | 113.0 |  |
 | December | 114.1 | 112.6 | 109.3 | 114.9 | 113.5 |  |
 | March | 115.4 | 113.7 | 109.8 | 116.2 | 114.7 |  |
 | June | 120.3 | 114.9 | 110.5 | 117.4 | 116.1 |  |
| 2007-2008 |  |  |  |  |  |  |
 | September | 124.8 | 116.2 | 111.4 | 119.0 | 117.4 |  |
 | December | 130.1 | 117.8 | 112.4 | 120.2 | 119.2 |  |
 | March | r131.0 | 119.9 | 113.8 | 121.1 | 121.2 |  |
 | June | p130.7 | 121.1 | 115.5 | 122.9 | 122.5 |  |
| 2008-2009 |  |  |  |  |  |  |
 | September | p128.3 | 122.8 | 118.6 | nya | nya |  |
Percentage change from previous quarter |  |
|  |
| 2006-2007 |  |  |  |  |  |  |
 | June | 4.2 | 1.1 | 0.6 | 1.0 | r1.2 |  |
| 2007-2008 |  |  |  |  |  |  |
 | September | 3.7 | 1.1 | 0.8 | 1.4 | 1.1 |  |
 | December | 4.2 | 1.4 | 0.9 | 1.0 | 1.5 |  |
 | March | r0.7 | 1.8 | 1.2 | 0.7 | 1.7 |  |
 | June | p-0.2 | 1.0 | 1.5 | 1.5 | 1.1 |  |
| 2008-2009 |  |  |  |  |  |  |
 | September | p-1.8 | 1.4 | 2.7 | nya | nya |  |
|  |
| nya not yet available |
| p preliminary figure or series subject to revision |
| r revised |
| (a) Base of each index - 2003-04 = 100.0. |
| (b) Weighted average of six capital cities. |
| Source: House Price Indexes: Eight Capital Cities, (cat. no. 6416.0) and Producer Price Indexes, (cat. no. 6427.0) |