EXPENDITURE ON CULTURE
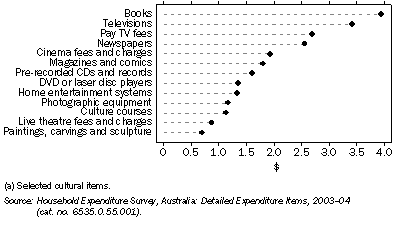
3.1 AVERAGE WEEKLY HOUSEHOLD EXPENDITURE ON CULTURE(a) - 2003-04

In 2003-04, Australian households spent 4% of their total expenditure on cultural goods and services. Households spent the largest amounts on Books ($1,587m), Televisions ($1,376m), Pay TV fees ($1,084m) and Newspapers ($1,031m).
3.2 EXPENDITURE ON CULTURE BY AUSTRALIAN HOUSEHOLDS - 2003-04 |
|
 |  | Average household expenditure | Total household expenditure |
 |  | $/week | $m/year |
|
| Literature |  |  |
 | Books | 3.94 | 1 587 |
 | Newspapers | 2.56 | 1 031 |
 | Magazines and comics | 1.80 | 727 |
 | Other printed material | 0.14 | 55 |
 | Total | 8.44 | 3 400 |
| Music |  |  |
 | Pre-recorded compact discs and records (audio) | 1.60 | 646 |
 | Audio cassettes and tapes | 0.05 | 19 |
 | Total | 1.65 | 665 |
| Performing arts |  |  |
 | Live theatre fees and charges | 0.87 | 353 |
 | Music concert fees and charges | 0.72 | 291 |
 | Total | 1.59 | 644 |
| Visual arts and crafts |  |  |
 | Studio and other professional photography | 0.50 | 203 |
 | Paintings, carvings and sculptures | 0.70 | 282 |
 | Art and craft materials | 0.46 | 184 |
 | Total | 1.66 | 668 |
| Broadcasting, electronic media and film |  |  |
 | Hire of video cassette tapes and TV or computer games | 1.17 | 473 |
 | Pre-recorded video cassettes and video discs | 2.08 | 840 |
 | Cinema fees and charges | 1.93 | 779 |
 | Pay TV fees | 2.69 | 1 084 |
 | Total | 7.87 | 3 176 |
| Other arts |  |  |
 | Musical instruments and accessories | *0.67 | *272 |
 | Culture courses | 1.14 | 459 |
 | Cultural fees and charges n.e.c | 0.05 | 19 |
 | Total | 1.86 | 750 |
| Heritage |  |  |
 | Art gallery and museum fees and charges | 0.15 | 61 |
 | National park and zoos fees and charges | 0.24 | 98 |
 | Total | 0.39 | 159 |
| Other culture |  |  |
 | Radios | 0.07 | 27 |
 | CD players | 0.36 | 145 |
 | Integrated sound systems | 0.25 | 100 |
 | Other audio equipment(a) | *0.58 | *239 |
 | Televisions | 3.41 | 1 376 |
 | Home entertainment systems | 1.33 | 537 |
 | Television aerials | *0.06 | *26 |
 | Video cassette recorders | 0.36 | 145 |
 | Video cameras | 0.92 | 371 |
 | Digital video disc players or laser disc players | 1.36 | 550 |
 | Other video equipment(b) | *0.42 | *168 |
 | Audiovisual parts n.e.c | 0.22 | 90 |
 | Hire of televisions | *0.06 | *26 |
 | Blank video cassettes and video discs | 0.21 | 86 |
 | Repair and maintenance of audiovisual equipment and personal computers | 1.00 | 404 |
 | Audiovisual equipment and personal computer repairs insurance | 0.09 | 37 |
 | Photographic equipment (excluding film and chemicals) | 1.17 | 471 |
 | Photographic film and chemicals (including developing) | 1.07 | 433 |
 | Total(c) | 12.94 | 5 231 |
| Total expenditure on culture | 36.40 | 14 694 |
|
| * estimate has a relative standard error of 25% to 50% and should be used with caution |
| (a) Includes amplifiers and tuner-amplifiers, speakers, and audio equipment n.e.c. |
| (b) Includes set top boxes and video equipment n.e.c. |
| (c) Also includes hire of video cassette recorders, but this was negligible. |
| Source: Household Expenditure Survey, Australia: Detailed Expenditure Items, 2003-04 (cat. no. 6535.0.55.001); ABS data available on request, Household Expenditure Survey, 2003-04. |
 Print Page
 Print All