NOM and population growth
Each change to the inward and outward flow of NOM contributes to changes in the growth, size and structure of Australia's population. The official measure of Australia's population is based on the concept of usual residence. As such it includes all people, regardless of nationality, citizenship or legal status, who usually live in Australia (for 12 months or more), with the exception of foreign diplomatic personnel and their families.
Australia's population increases each year as a result of both natural increase (births minus deaths) and NOM (NOM arrivals minus NOM departures). In 2008-09, preliminary NOM estimates added a net of 298,900 persons to Australia's population. This is the highest ever recorded and represents 65% of Australia's total population growth for the year (456,700 persons). The remaining 35% was due to natural increase (the number of births minus the number of deaths) with 157,800 persons.
Table 3.3 shows the components of population change over the previous 20 years and the impact NOM has had each year on Australia's population growth. During the majority of this time period, the contribution of NOM to population growth was less than half, whereas in the last three years it has been the major contributor adding 62.2%, 65.1% and 65.5% respectively to Australia's total population growth for each year. This increase is partly due to improvements in methodology which better measures the actual true travel behaviour of migrants but also reflects the recent increases of temporary migrants arriving in Australia (see Figure 3.13).
3.3 NOM and components of population change - Australia |
|
 | Components of population change | Population |
| Net overseas migration(a) | Births | Deaths | Natural increase | At end of period | Growth(b) | Growth(b) | NOM proportion of total growth |
| '000 | '000 | '000 | '000 | '000 | '000 | % | % |
|
| 1989-90 | 124.6 | 257.5 | 125.1 | 132.4 | 17 065.1 | 250.7 | 1.49 | 49.7 |
| 1990-91 | 86.4 | 261.2 | 119.6 | 141.6 | 17 284.0 | 218.9 | 1.28 | 39.5 |
| 1991-92 | 68.6 | 259.2 | 120.8 | 138.4 | 17 494.7 | 210.6 | 1.22 | 32.6 |
| 1992-93 | 30.0 | 260.0 | 121.3 | 138.6 | 17 667.1 | 172.4 | 0.99 | 17.4 |
| 1993-94 | 46.5 | 258.3 | 123.5 | 134.8 | 17 854.7 | 187.6 | 1.06 | 24.8 |
| 1994-95 | 80.1 | 258.2 | 126.2 | 132.0 | 18 071.8 | 217.0 | 1.22 | 36.9 |
| 1995-96 | 104.1 | 250.4 | 126.4 | 124.0 | 18 310.7 | 239.0 | 1.32 | 43.6 |
| 1996-97 | 87.1 | 253.7 | 127.3 | 126.4 | 18 517.6 | 206.9 | 1.13 | 42.1 |
| 1997-98 | 79.2 | 249.1 | 129.3 | 119.9 | 18 711.3 | 193.7 | 1.05 | 40.9 |
| 1998-99 | 96.5 | 250.0 | 128.3 | 121.7 | 18 925.9 | 214.6 | 1.15 | 45.0 |
| 1999-2000 | 107.3 | 249.3 | 128.4 | 120.9 | 19 153.4 | 227.5 | 1.20 | 47.1 |
| 2000-01 | 135.7 | 247.5 | 128.9 | 118.6 | 19 413.2 | 259.9 | 1.36 | 52.2 |
| 2001-02 | 110.6 | 247.3 | 130.3 | 117.0 | 19 651.4 | 238.2 | 1.23 | 46.4 |
| 2002-03 | 116.5 | 246.7 | 132.2 | 114.4 | 19 895.4 | 244.0 | 1.24 | 47.7 |
| 2003-04 | 100.0 | 249.1 | 133.2 | 115.9 | 20 127.4 | 231.9 | 1.17 | 43.1 |
| 2004-05 | 123.8 | 255.9 | 131.4 | 124.6 | 20 394.8 | 267.4 | 1.33 | 46.3 |
| 2005-06 | 146.8 | 263.5 | 134.0 | 129.5 | 20 697.9 | 303.1 | 1.49 | 48.4 |
| 2006-07 | 232.8 | 277.7 | 136.0 | 141.7 | 21 072.5 | 374.6 | 1.81 | 62.2 |
| 2007-08 | 277.3 | 289.5 | 140.7 | 148.8 | 21 498.5 | 426.1 | 2.02 | 65.1 |
| 2008-09(c) | 298.9 | 300.9 | 143.1 | 157.8 | 21 955.3 | 456.7 | 2.12 | 65.5 |
|
| (a) Contains a break in series at 30 June 2006 - see paragraphs 26-27 of the Explanatory Notes. |
| (b) Prior to 2006-07, differences between growth and sum of components are due to intercensal discrepancy. |
| (c) Estimates for 2008-09 are preliminary - see paragraphs 9-10 of the Explanatory Notes. |
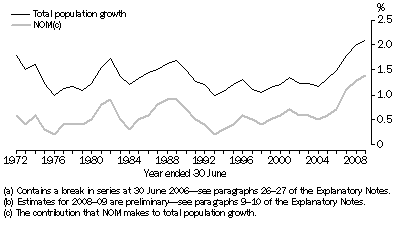
Australia's total population growth rate for 2008-09 was 2.1% with NOM contributing 1.4% to this growth (see Figure 3.4). The peaks and troughs in Australia's annual population growth are clearly driven by NOM. Over time, however, the long-term trend shows that NOM has had an increasing contribution to Australia's population growth.
3.4 Population Growth rate & NOM contribution(a)(b)
- Australia
 Quality Declaration
  Print Page
 Print All