Contents >>
Products >>
International trade in sport and physical recreation goods
INTERNATIONAL TRADE IN SPORT AND PHYSICAL RECREATION GOODS
International trade statistics are compiled from information supplied to Customs by exporters and importers or their agents. There are 3 million export transactions and 13 million import transactions recorded each year, many of which are small value records. Due to the large volume of transactions involved and the limited resources available to undertake checks, ABS editing resources are mostly focussed on editing large value records. The majority of data about international trade in sport and physical recreation goods relate to small value records, which are 'as reported to Customs'. More information about the quality of international trade data are included in the ABS (2008e) publication Information Paper: International Trade - Ensuring Data Quality, 2008 (cat. no. 5498.0.55.001).
There are some sport and physical recreation goods for which trade data are not separately available, primarily because they are parts of larger product categories predominantly out of scope of the ACLC Product Classification. Sports apparel is one example where the various items of sports apparel are not separately identified in trade statistics, but are instead included in parts of more general categories of clothing. Another example is automatic bowling alley equipment, which for the purposes of international trade, is part of the category other articles for funfair, table or parlour games. This category is predominantly in scope of the other leisure goods part of the ACLC Product Classification and hence is excluded from data concerning international trade in sport and physical recreation goods.
Australia's trade in selected sport and physical recreation goods is in deficit. Imports of these goods during 2010-11 were valued at $2 billion. This is over six times the $310.1m in sport and physical recreation goods which were exported during that year.
Exports of sport and physical recreation goods
Sport and physical recreation goods exported from Australia during 2010-11 were valued at $310.1m, decreasing 23% from the $403.5m recorded for 2009-10.
Since 2004-05, boats, yachts and other vessels for pleasure or sports and horses have been the two main categories of goods contributing to the total value of sport and physical recreation goods exported. In 2010-11 these two categories made up just over 60% of the total value of exported sport and physical recreation goods.
For boats, yachts and other vessels for pleasure or sports, the value (in current prices) has decreased from $267.7m in 2007-08 to $100.2m in 2010-11. The value of exports of horses decreased from $152.5m in 2008-09 to $92.4m in 2010-11.
Other goods categories which have made substantial contributions to total exports since 2004-05 are spark-ignition marine outboard motors with a value of $15.4m in 2010-11 and water skis, surfboards, sailboards and other water sports equipment, contributing $12.2m to the total value of exports of sport and physical recreation goods in 2010-11.
Interestingly, the value of exported swimwear for women and girls has increased since 2004-05 from $12.9m to $14.8m in 2010-11. The value of exported golf clubs and other golf equipment has remained about the same, with a value of around $8.0m.
12.1 Exports of selected sport and physical recreation goods(a), Current prices - 2004-05 to 2010-11 |
|
 | 2004-05 | 2005-06 | 2006-07 | 2007-08 | 2008-09 | 2009-10 | 2010-11 |
| $m | $m | $m | $m | $m | $m | $m |
|
| Boats, yachts and other vessels for pleasure or sports | 199.9 | 230.3 | 232.6 | 267.7 | 181.0 | 140.8 | 100.2 |
| Horses | 101.9 | 114.4 | 141.8 | 88.7 | 152.5 | 130.2 | 92.4 |
| Other articles and equipment for sports or physical recreation; swimming pools and paddling pools | 22.4 | 22.2 | 25.2 | 25.3 | 21.5 | 22.0 | 17.6 |
| Spark-ignition marine outboard motors | 15.3 | 17.2 | 11.7 | 17.5 | 16.3 | 17.1 | 15.4 |
| Swimwear for women and girls | 12.9 | 10.6 | 11.7 | 12.2 | 13.1 | 12.1 | 14.8 |
| Waterskis, surfboards, sailboards and other water sports equipment | 21.2 | 21.7 | 21.8 | 15.6 | 14.3 | 14.0 | 12.2 |
| Golf clubs and other golf equipment | 7.7 | 12.1 | 11.4 | 11.1 | 9.1 | 9.7 | 8.2 |
| Sports or physical recreation footwear | 6.0 | 8.3 | 5.8 | 6.2 | 10.1 | 7.8 | 7.8 |
| Total(b) | 436.6 | 483.2 | 510.9 | 489.1 | 463.4 | 403.5 | 310.1 |
|
| (a) All data are presented in Australian dollars using 'Free on Board' valuations. |
| (b) Total includes exports of all sport and physical recreation goods. |
| Source: ABS data available on request, International Trade in Goods and Services, Australia. |
Destination of exports
Throughout the period 2004-05 to 2010-11 New Zealand and the United States of America (USA) have been among the main destinations for sport and physical recreation goods exported from Australia. For 2010-11, the value of exports to New Zealand was $71.0m, and the value of goods exported to the USA was $40.2m.
In 2010-11 the value of goods exported to Hong Kong (SAR of China) was $25.8m, although this was down on previous years.
12.2 Exports of selected sport and physical recreation goods(a), Current Prices, By destination - 2004-05 to 2010-11 |
|
| 2004-05 | 2005-06 | 2006-07 | 2007-08 | 2008-09 | 2009-10 | 2010-11 |
| $m | $m | $m | $m | $m | $m | $m |
|
| New Zealand | 108.8 | 126.9 | 138.6 | 100.6 | 108.9 | 111.9 | 71.0 |
| United States of America | 95.4 | 105.4 | 95.8 | 117.7 | 63.1 | 34.0 | 40.2 |
| Hong Kong (SAR of China) | 29.2 | 35.3 | 39.0 | 33.7 | 49.1 | 37.9 | 25.8 |
| United Kingdom | 14.1 | 14.0 | 24.4 | 18.2 | 17.9 | 11.3 | 15.2 |
| Singapore | 7.9 | 12.8 | 24.6 | 16.4 | 20.1 | 17.4 | 14.9 |
| Papua New Guinea | 5.0 | 6.4 | 4.5 | 11.8 | 12.1 | 11.8 | 12.9 |
| Japan | 17.8 | 16.8 | 19.7 | 10.2 | 12.3 | 9.3 | 10.8 |
| United Arab Emirates | 7.5 | 9.0 | 12.2 | 9.4 | 15.4 | 24.7 | 6.4 |
| South Africa | 8.8 | 14.0 | 20.2 | 11.2 | 16.5 | 12.8 | 6.3 |
| Italy | 22.6 | 23.0 | 19.7 | 29.4 | 24.2 | 12.2 | 1.0 |
| Other Countries | 119.5 | 119.8 | 112.3 | 130.4 | 123.9 | 120.1 | 105.7 |
| Total | 436.6 | 483.2 | 510.9 | 489.1 | 463.4 | 403.5 | 310.1 |
|
| (a) All data are presented in Australian dollars using 'Free on Board' valuations. |
| Source: ABS data available on request, International Trade in Goods and Services, Australia. |
The value of exports to Italy has decreased most dramatically from $29.4m in 2007-08 to only $1.0m in 2010-11. In recent years, the value of exports to the United Arab Emirates fluctuated from $24.7m in 2009-10 to $6.4m in 2010-11. The value of exports to South Africa has halved since 2009-10 from $12.8m to $6.3m in 2010-11. Minor increases can be seen in the value of goods exported to United Kingdom (from $11.3m in 2009-10 to $15.2m in 2010-11) and to Japan (from $9.3m to $10.8m).
These fluctuations in the value of exports of sport and physical recreation goods may be a result of relatively large value items such as boats and horses included in the data. Relatively small fluctuations in the volume of exports of these goods can have a relatively large impact on the value of exports to an individual country.
Imports of sport and physical recreation goods
The value (in current prices) of sport and physical recreation goods imported into Australia during 2010-11 was $2,036.3m. This was 7% higher than the $1,899.2m recorded in 2009-10.
12.3 Imports of selected sport and physical recreation goods(a), Current prices - 2004-05 to 2010-11 |
|
| 2004-05 | 2005-06 | 2006-07 | 2007-08 | 2008-09 | 2009-10 | 2010-11 |
| $m | $m | $m | $m | $m | $m | $m |
|
| Boats, yachts and other vessels for pleasure or sports | 373.6 | 474.6 | 521.3 | 591.9 | 447.9 | 392.3 | 502.0 |
| Bicycles and other cycles, not motorised | 149.9 | 163.6 | 174.9 | 174.5 | 239.9 | 199.5 | 219.7 |
| General physical exercise, gymnasium or athletics articles and equipment | 155.1 | 203.5 | 241.1 | 227.4 | 247.4 | 221.6 | 216.6 |
| Sports or physical recreation footwear | 159.9 | 156.6 | 175.8 | 142.4 | 161.6 | 152.4 | 142.5 |
| Spark-ignition marine outboard motors | 182.4 | 208.2 | 186.3 | 169.8 | 137.6 | 143.6 | 131.2 |
| Articles and equipment for sports or outdoor games n.e.s.; swimming pools and paddling pools | 74.3 | 85.2 | 109.8 | 100.7 | 127.9 | 125.0 | 130.4 |
| Horses | 84.2 | 108.2 | 130.3 | 129.0 | 101.9 | 98.1 | 123.3 |
| Golf clubs and other golf equipment | 92.4 | 90.9 | 91.1 | 85.6 | 92.9 | 83.2 | 75.1 |
| Total(b) | 1 667.5 | 1 930.4 | 2 102.2 | 2 088.3 | 2 065.2 | 1 899.2 | 2 036.3 |
|
| (a) All data are presented in Australian dollars using 'Customs Values' valuations. |
| (b) Total includes imports of all sport and physical recreation goods. |
| Source: ABS data available on request, International Trade in Goods and Services, Australia. |
Boats, yachts and other vessels for pleasure or sports ($502.0m), bicycles and other cycles, not motorised ($219.7m) and general physical exercise, gymnasium or athletics articles and equipment ($216.6m) were the product categories which contributed most to the value of imports of sport and physical recreation goods in 2010-11. These categories also had high values in previous years. Other categories in the top five for 2010-11 were sports or physical recreation footwear ($142.5m) and spark-ignition marine outboard motors ($131.2m). Together, these five sport and physical recreation product categories accounted for nearly two thirds (60% or $1,212.0m) of total imports of sport and physical recreation goods in 2010-11.
Origin of imports
Throughout the period 2004-05 to 2010-11, China and the USA have been the major sources of sport and physical recreation goods imported into Australia. In 2010-11, the combined value of imports from these two countries amounted to $1,111.6m, which was over half the total value of all imported sport and physical recreation goods in this period. China was the largest contributor to this figure with total imports worth $742.0m. The USA contributed $369.6m which was more than double the $171.4m worth of goods imported from Taiwan, which was the next placed contributor to the overall value of sport and physical recreation goods imported into Australia in 2010-11.
Along with China, the USA and Taiwan, Japan, New Zealand and the United Kingdom have been the top six sources of imported sport and physical recreation goods in Australia since 2004-05.
12.4 Imports of selected sport and physical recreation goods(a), Current prices - By country of origin - 2004-05 to 2010-11 |
|
| 2004-05 | 2005-06 | 2006-07 | 2007-08 | 2008-09 | 2009-10 | 2010-11 |
| $m | $m | $m | $m | $m | $m | $m |
|
| China | 501.4 | 584.4 | 706.2 | 685.6 | 794.1 | 723.9 | 742.0 |
| United States of America | 382.2 | 473.6 | 422.9 | 415.3 | 368.4 | 334.9 | 369.6 |
| Taiwan | 136.3 | 156.7 | 169.3 | 155.4 | 211.8 | 158.4 | 171.4 |
| Japan | 145.6 | 161.5 | 133.0 | 145.2 | 103.8 | 110.4 | 110.9 |
| New Zealand | 100.6 | 98.6 | 115.1 | 119.9 | 99.8 | 101.8 | 125.9 |
| United Kingdom | 78.5 | 102.6 | 126.4 | 130.4 | 92.1 | 76.8 | 93.2 |
| Italy | 29.6 | 36.7 | 52.8 | 59.2 | 30.2 | 52.1 | 46.5 |
| France | 34.7 | 34.5 | 47.8 | 59.5 | 35.6 | 39.9 | 50.5 |
| Canada | 22.7 | 29.7 | 50.9 | 40.0 | 34.1 | 33.1 | 31.8 |
| Viet Nam | 25.6 | 24.8 | 31.9 | 26.6 | 30.5 | 32.7 | 31.1 |
| India | 28.5 | 28.8 | 34.7 | 29.8 | 29.6 | 30.0 | 32.3 |
| Hong Kong (SAR of China) | 18.7 | 20.0 | 20.7 | 19.2 | 31.2 | 20.0 | 16.6 |
| Total(b) | 1 667.5 | 1 930.4 | 2 102.2 | 2 088.3 | 2 065.2 | 1 899.2 | 2 036.3 |
|
| (a) All data are presented in Australian dollars using 'Customs Values' valuations. |
| (b) Total includes imports of all sport and physical recreation goods. |
| Source: ABS data available on request, International Trade in Goods and Services, Australia. |
In 2010-11 the value of imported sport and physical recreation goods from China increased by 2.5% from $723.9m in 2009-10 to $742.0m, and has increased by nearly half since 2004-05 ($501.4m). The largest increase, of 10%, was in the value of imports from the USA from $334.9m in 2009-10 to $369.6m in 2010-11. The value of imports from Japan stayed at around the same value between 2009-10 and 2010-11 (about $110.0m). Since 2004-05, the value of imports from Taiwan has increased by 26% from $136.3m to $171.4m in 2010-11.
Balance of trade in sporting and physical recreation goods
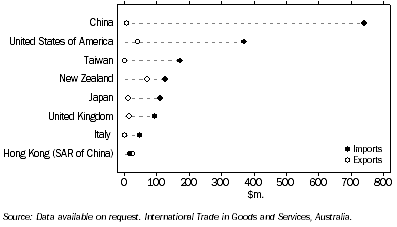
The countries shown in Graph 12.5 were Australia's major trading partners in sport and physical recreation goods for 2010-11. That is, they were the countries with which total transactions (exports and imports) were greatest. Australia had a trade deficit with all but one of these countries in 2010-11 for sport and physical recreation goods. The largest trade deficit was with China ($735.3m), followed by the USA ($329.4m), Taiwan ($170.6m) and Japan ($100.1m). Australia had a trade surplus in sporting and physical recreation goods with Hong Kong (SAR of China) ($9.2m).
12.5 Balance of trade in selected sport and physical recreation goods - 2010-11
 Print Page
 Print All