Household income and disadvantage
According to the 2003-04 ABS Household Expenditure Survey (HES), households with the lowest incomes spend a higher proportion of their income on food and non-alcoholic beverages than households with the highest incomes, after accounting for households of different size and composition(footnote 1) . Studies have shown that energy-dense foods composed of refined grains and added sugars or fats may represent the lowest cost option to consumers compared with diets based on lean meats, fish, fresh vegetables and fruit. For this reason, people in lower-income households may be more inclined to consume energy dense foods than healthier food options(footnote 2) , which may result in higher rates of overweight and obesity.
Data from the 2007-08 NHS shows that slightly more adults in households with the lowest incomes (8%) ate the recommended daily serves of fruit and vegetables than those in households with the highest incomes (6%), but they were less likely to exercise. Almost four out of five adults in households with the lowest incomes were sedentary or exercised at low levels (79%) compared with 61% of adults in households with the highest incomes. Furthermore, over half of adults in the lowest income households did no exercise at all in the week prior to the survey, compared with around a quarter of adults in households with the highest incomes.
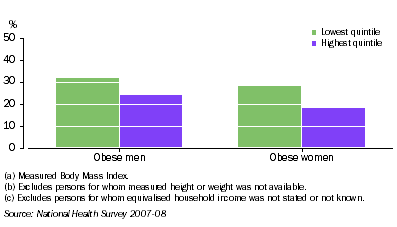
Rates of obesity were higher in households with lower incomes than in households with higher incomes.
4.3 Proportion of people obese(a)(b), by Equivalised household income(c)

The Socio-economic Indexes for Areas (SEIFA) Index of Disadvantage summarises various attributes such as income, unemployment and educational attainment of an area in which people reside. Apart from socio-economic differences between areas in terms of income, employment and education, some areas also offer greater opportunities for physical activity and greater access to healthy food options
(footnote 3) .
After adjusting for age, adults living in areas with the highest levels of disadvantage had the highest prevalence of overweight and obesity (66%), while those living in areas of least disadvantage had the lowest prevalence (55%). In particular, the obesity rates for both men and women living in areas of most disadvantage were significantly higher than the corresponding rates for those living in areas of least disadvantage (Graph 4.4).
4.4 Proportion of people obese(a)(b), by Index of Disadvantage(c)(d)

1 ABS (Australian Bureau of Statistics) 2006. Household Expenditure Survey, Australia: Summary of Results, 2003-04. ABS Cat. No. 6530.0. Canberra ABS
<back
2 Drewnowski A and Specter S. Poverty and obesity: the role of energy density and energy costs. American Journal of Clinical Nutrition, 2004; 79: 6-16. Available from http://www.ajcn.org/content/79/1/6.full.pdf+html
<back
3 King T, Kavanagh AM, Jolley D, Turrell D and Crawford D, 2006, ‘Weight and place: a multilevel cross sectional survey of area-level disadvantage and overweight/obesity in Australia’, International Journal of Obesity 30, p 281-287. Available from http://www.nature.com/ijo/journal/v30/n2/pdf/0803176a.pdf
<back
 Print Page
 Print All