STATE FINAL DEMAND
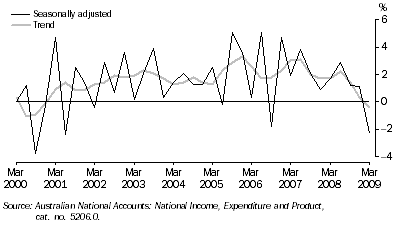
- State final demand (trend chain volume measures) in Western Australia fell 0.4% to just over $35 billion in the March 2009 quarter. This was the first decrease since December 2000. Nationally, domestic final demand also recorded a fall of 0.3% in the March quarter 2009.
- Decreases in state final demand were recorded in the March quarter in the majority of states and territories, including New South Wales (down 0.1%), Victoria (down 0.3%), Australian Capital Territory (down 0.7%) and Queensland (down 1.4%). South Australia was the only state that recorded an increase (0.6%) in the March 2009 quarter.
STATE FINAL DEMAND, Chain volume measures
- Change from previous quarter

- In seasonally adjusted chain volume measures, Western Australia recorded a decrease of 2.3% in state final demand in the March 2009 quarter. Contributing to the decline was a fall in private gross fixed capital (down 7.6%).
- In contrast, public gross fixed capital formation increased 6.2%. There were also minimal increases in final consumption expenditure for general government and households in the March quarter (0.4% and 0.8% respectively).
1 Components of State Final Demand, Chain Volume Measures(a) |
|
 |  |  |  |  | Percentage change
|
 |  | Mar 08 | Dec 08 | Mar 09 | Previous qtr | Same qtr
previous
year |
 |  | $m | $m | $m | % | % |
TREND |
|
| Final consumption expenditure |  |  |  |  |  |
 | General government | 4 345 | 4 436 | 4 450 | 0.3 | 2.4 |
 | Households | 15 161 | 15 626 | 15 819 | 1.2 | 4.3 |
 | Total final consumption expenditure | 19 506 | 20 062 | 20 269 | 1.0 | 3.9 |
| Private gross fixed capital formation | 12 915 | 13 589 | 13 221 | -2.7 | 2.4 |
| Public gross fixed capital formation | 1 383 | 1 492 | 1 537 | 3.0 | 11.1 |
| State final demand | 33 804 | 35 143 | 35 019 | -0.4 | 3.6 |
SEASONALLY ADJUSTED |
|
| Final consumption expenditure |  |  |  |  |  |
 | General government | 4 335 | 4 435 | 4 451 | 0.4 | 2.7 |
 | Households | 15 248 | 15 655 | 15 781 | 0.8 | 3.5 |
 | Total final consumption expenditure | 19 583 | 20 090 | 20 232 | 0.7 | 3.3 |
| Private gross fixed capital formation | 12 654 | 13 896 | 12 846 | -7.6 | 1.5 |
| Public gross fixed capital formation | 1 427 | 1 470 | 1 561 | 6.2 | 9.4 |
| State final demand | 33 664 | 35 456 | 34 639 | -2.3 | 2.9 |
|
| (a) Reference year for chain volume measures is 2006-07. |
Source: Australian National Accounts: National Income, Expenditure and Product, cat. no. 5206.0.
To view Excel spreadsheet: State Final Demand
|
 Print Page
 Print All
 Print Page
 Print All