 BARLEY AND SELECTED OTHER GRAINS AND PULSES
STOCKS AND USE OF BARLEY AND SELECTED OTHER GRAINS AND PULSES
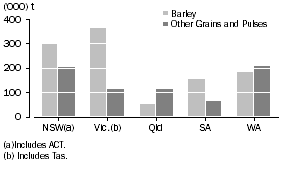
In March 2010, there were 1.0 million tonnes of barley stored by wheat users in Australia, a decrease of 839 thousand tonnes (44%) from the December 2009 quarter. Victorian wheat users held the greatest amount of barley in March 2010, storing 362 thousand tonnes, followed by New South Wales with 296 thousand tonnes.
There were 700 thousand tonnes of selected other grains and pulses stored by wheat users in Australia in March 2010, a decrease of 49% from December 2009. Wheat users in Western Australia held the greatest amount, storing 208 thousand tonnes, followed by New South Wales with
203 thousand tonnes.
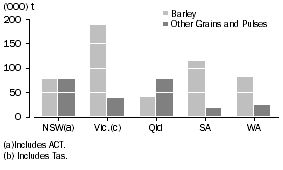
Wheat users in Australia used 500 thousand tonnes of barley in the March quarter of 2010. Victorian wheat users recorded the highest use of barley at 188 thousand tonnes, followed by South Australia with 114 thousand tonnes.
Australian wheat users consumed 232 thousand tonnes of selected other grains and pulses in the March quarter of 2010, representing a fall in usage of 48% from December 2009. Queensland recorded the highest use of selected other grains and pulses at 77 thousand tonnes in March 2010, followed by New South Wales with 76 thousand tonnes.
STOCKS OF BARLEY AND OTHER GRAINS AND PULSES, March 2010
USE OF BARLEY AND OTHER GRAINS AND PULSES, March 2010
 Quality Declaration
  Print Page
 Print All