 CROPS
CROPS
OVERVIEW
Production increased for a number of broadacre crops in 2009-10, in particular wheat, lupins, rice and cotton, despite variable seasonal conditions.
CROPS FOR GRAIN
Wheat
The total area sown to wheat for grain in 2009-10 increased by 3% to 13.9 million hectares. Production rose by 2% to 21.8 million tonnes from 2008-09. Production of wheat decreased in all states, except Victoria, up by 71% to 3.0 million tonnes and in South Australia, up by 68% to 4.0 million tonnes. Due mainly to drought conditions, production in New South Wales was down by 23% to 5.3 million tonnes.
Barley
In 2009-10, the total area sown to barley decreased by 12% to 4.4 million hectares. Production was 2% lower than in 2008-09 at 7.9 million tonnes. Production of barley decreased in all states, except Victoria, up by 28% to 1.9 million tonnes and South Australia, up by 10% to 2.1 million tonnes. Production in Tasmania remained steady at 29,000 tonnes. In New South Wales, production decreased by 15% to 1.2 million tonnes due to drought, flooding and reduced water allocation.
Oats
The total area sown to oats decreased by 2% in 2009-10 to 850,000 hectares. Production in 2009-10 increased marginally to 1.2 million tonnes. Production in New South Wales fell by 19% to 211,000 tonnes and in Western Australia by 13% to 493,000 tonnes. Increases in oat production were experienced in Victoria, up by 27% to 300,000 tonnes and in South Australia, up by 77% to 144,000 tonnes. These increases were due to good rainfall and greater water availability.
Grain Sorghum
There was a 35% decrease in the total area sown to sorghum for grain in 2009-10, with 498,000 hectares sown. Production decreased by 44% to 1.5 million tonnes, with all states recording falls from the previous year.
Lupins
In 2009-10, the total area sown to lupins increased by 20% to 692,000 hectares and production increased by 16% to 823,000 tonnes. New South Wales, South Australia and Western Australia all experienced improved conditions for lupins.
Rice
The total area sown to rice more than doubled in 2009-10 to 19,000 hectares, compared with the previous year, due to increased availability of water for irrigation. Production similarly increased to 197,000 tonnes. However, these figures are still markedly below the levels recorded ten years ago.
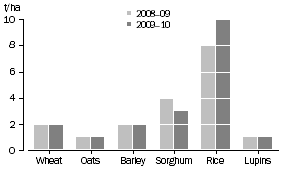
YIELD, CROPS FOR GRAIN - 2008-09 AND 2009-10

OTHER CROPS
Canola
In 2009-10, the total area planted to canola increased marginally to 1.7 million hectares. Western Australia experienced an increase, up by 7% to 981,000 hectares, with decreased plantings recorded in most other states and the Australian Capital Territory.
Cotton
The total area of cotton planted in 2009-10 increased by 24% to 196,000 hectares. Production of cotton lint also increased by 14% to 352,000 tonnes in 2009-10. Queensland growers experienced lower production, down by 10% to 138,000 tonnes, due to lack of rain and water availability. Production in New South Wales increased by 38% to 214,000 tonnes.
Sugar cane
In 2009-10, the total area planted to sugar cane for crushing decreased slightly to 389,000 hectares. National production of sugar cane cut for crushing decreased by 1% to 31 million tonnes in 2009-10. Sugar cane production in Queensland decreased by 2% to 29 million tonnes, while New South Wales production increased by 18% to 1.9 million tonnes.
 Print Page
 Print All
 Quality Declaration