Australia-born and overseas-born
During the 10 years to June 2009, the number of Australia-born residents increased at an average rate of 1.0% per year, while the number of overseas-born residents increased at 2.9% per year. The age and sex structures of the two groups are distinctive, as reflected by the population pyramids, Figures 5.4 and 5.5.
Age and sex of total population
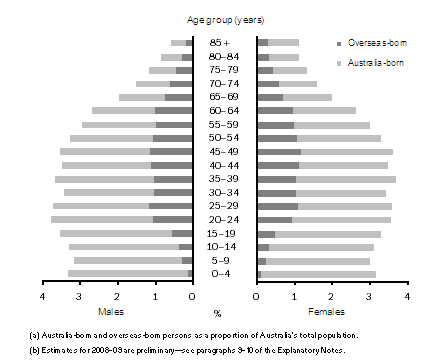
The age structures of people born in Australia and people born overseas are markedly different. The population pyramid in Figure 5.4 contains the age and sex structure of Australia's total population and includes the proportions of Australia-born and overseas-born.
As shown in Figure 5.4, persons born in Australia dominate the population in the younger age groups, while overseas-born persons increase, relative to the Australia-born population, as the age groups become older. The main reason why there are fewer overseas-born in the younger age groups is that most people are far less likely to migrate with young families.
At 30 June 2009, the 25-29, 40-44 and 45-49 years age groups had the highest proportion of overseas-born persons, as a percentage of Australia's total population, for both males and females. In contrast, the largest age group for the Australia-born population was the 0-4 years age group, for both males and females. The older age groups (80-84 years, 85 years and older) had the lowest proportion of Australia-born persons.
Between 2008 and 2009, the Australia-born proportion of the total population declined slightly within the age groups spanning from 5-9 years through to 50-54 years. This reduction is a combined effect of declining fertility rates from the mid to late 1970s and the optimum age for long-term overseas travel. Persons aged in their 20s to 30s are considered to be in their optimum age for making long-term overseas travel.
5.4 Population structures of Australia(a)
, Country of birth, age and sex - 30 June 2009(b)

Age and sex structures of people born in Australia and overseas
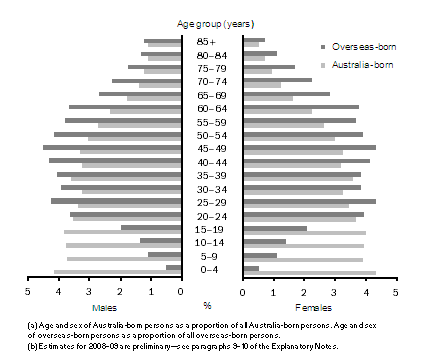
The age and sex structures of the Australia-born and the overseas-born show two very different populations. The following two population pyramids combined in Figure 5.5 show each group's age and sex structure as a proportion of their respective populations.
The age groups with the highest proportions of the male overseas-born population were 25
-29 years, 40-44 years and 45-49 years, with 4.4%, 4.2% and 4.4% respectively of the total overseas-born population. The pattern was similar for females born overseas with age groups 25
-29 years, 40-44 years and 45-49 years as the largest proportions of the population, accounting for 4.3%, 4.3% and 4.5% respectively of the overseas-born population.
The lowest proportions of male overseas-born were those aged 0-4 years (0.5%), 5-9 years (1.1%) and those aged 85 years and over (0.7%). For females, the same age groups represented the lowest proportions within the overseas-born population (0.5%, 1.1% and 1.2% respectively).
For Australia-born persons, the largest proportions for males were those aged 0-4 years (4.4%), 5-9 years (3.9%), 10
-14 years and 15
-19 years (4.0% each). For females, the largest proportions were for the same age groups (4.1%, 3.7%, 3.8% and 3.8% respectively). The lowest proportions were those aged 80-84 years (0.7% for males, 1.1% for females) and 85 years and over (0.5% for males, 1.1% for females).
5.5 Population structures of Australia-born and overseas-born(a)
, Age and sex - 30 June 2009(b)

Median age of persons born overseas
The median age of all Australian residents born overseas at 30 June 2009 was 44.8 years, compared to 33.3 years for those born in Australia as shown in Table 5.6. Migrants from certain source countries who were part of the major post-second world war migration streams in the late 1940s and the 1950s were now generally from older age groups. Of the top 50 countries of birth, Italy had the oldest median age at 67.0 years, followed by Greece (65.6), Hungary (65.4) and Austria (62.6).
Of the top 50 countries of birth, the largest groups of overseas-born residents with lower median ages include New Zealand (38.9 years), China (34.6 years), and India (30.2 years). The youngest median ages were for persons born in Nepal (25.2 years), Sudan (25.9), the Republic of South Korea (28.4) and Afghanistan (28.7).
A comparison on the median age for each country by sex as seen in Table 5.6, reveals that women had a much older median age than men for the Philippines (42.2 and 35.3 years respectively), Thailand (32.1 and 26.6 years respectively) and Hong Kong (37.9 and 33.8 years respectively).
Sex ratio
At 30 June 2009, the sex ratio (males per 100 females) of the overseas-born population was the same as the Australia-born population (99 males per 100 females) as seen in Table 5.6. However, the sex ratio varied for different countries of birth, with Nepal (182 males per 100 females), Bangladesh (151), Pakistan (151) and India (144) having the highest ratios of males to females. The lowest sex ratios were recorded for persons born in Thailand (54 males per 100 females), Japan (57) and the Philippines (60).
5.6 Australia's top 50 countries of birth(a), Median age, sex ratio and estimated resident population - 30 June 2009(b) |
|
 | MEDIAN AGE |  |  |
| Selected Countries of birth | Persons | Males | Females | Sex Ratio(c) | ERP |
|
| Nepal | 25.2 | 25.3 | 25.0 | 181.6 | 24 657 |
| Sudan | 25.9 | 25.8 | 26.1 | 117.1 | 25 662 |
| Korea, Republic of (South) | 28.4 | 27.7 | 29.2 | 91.3 | 94 698 |
| Afghanistan | 28.7 | 28.4 | 29.1 | 114.9 | 24 746 |
| Thailand | 29.7 | 26.6 | 32.1 | 53.8 | 48 661 |
| India | 30.2 | 29.2 | 31.8 | 143.6 | 308 542 |
| Taiwan | 30.2 | 29.6 | 30.7 | 74.8 | 36 527 |
| Pakistan | 30.6 | 30.6 | 30.7 | 151.0 | 27 888 |
| Bangladesh | 30.7 | 30.9 | 30.3 | 151.2 | 25 453 |
| Japan | 31.3 | 29.4 | 32.1 | 56.8 | 51 014 |
| Indonesia | 32.1 | 31.1 | 32.9 | 80.0 | 69 689 |
| Singapore | 34.3 | 33.5 | 35.0 | 83.4 | 56 479 |
| China (excludes SARs and Taiwan) | 34.6 | 33.8 | 35.2 | 84.7 | 350 979 |
| Hong Kong (SAR of China) | 35.8 | 33.8 | 37.9 | 94.0 | 88 527 |
| Iraq | 35.8 | 37.1 | 34.4 | 109.1 | 45 674 |
| Zimbabwe | 36.4 | 36.9 | 35.9 | 100.9 | 30 327 |
| Malaysia | 37.1 | 35.6 | 38.4 | 86.5 | 129 575 |
| United States of America | 37.4 | 38.3 | 36.4 | 103.1 | 81 134 |
| Canada | 37.9 | 38.4 | 37.4 | 90.9 | 43 036 |
| South Africa | 38.0 | 37.8 | 38.3 | 99.8 | 149 024 |
| Iran | 38.5 | 38.5 | 38.5 | 113.6 | 31 564 |
| New Zealand | 38.9 | 38.8 | 39.0 | 105.4 | 529 178 |
| Papua New Guinea | 38.9 | 38.4 | 39.3 | 85.0 | 30 720 |
| France | 39.5 | 38.3 | 40.8 | 109.4 | 29 269 |
| Philippines | 39.5 | 35.3 | 42.2 | 59.6 | 168 501 |
| Fiji | 40.2 | 40.1 | 40.3 | 89.1 | 61 437 |
| Russian Federation | 41.3 | 39.5 | 42.4 | 64.0 | 21 654 |
| Cambodia | 41.4 | 41.7 | 41.0 | 86.7 | 30 415 |
| Sri Lanka | 41.4 | 40.7 | 42.0 | 106.4 | 87 411 |
| Vietnam | 41.8 | 42.5 | 41.1 | 89.1 | 203 852 |
| Turkey | 44.0 | 44.2 | 43.8 | 107.3 | 39 472 |
| Ireland | 45.6 | 44.3 | 47.0 | 115.6 | 70 008 |
| Mauritius | 45.6 | 44.6 | 46.6 | 100.7 | 26 344 |
| Bosnia and Herzegovina | 46.2 | 46.3 | 46.1 | 101.2 | 37 643 |
| Chile | 46.2 | 45.4 | 47.0 | 94.2 | 28 539 |
| Lebanon | 46.4 | 46.3 | 46.4 | 111.5 | 89 860 |
| Serbia (includes Kosovo) | 53.1 | 53.3 | 52.8 | 102.1 | 42 086 |
| UK, CI & IOM | 53.3 | 52.7 | 53.9 | 103.4 | 1 188 247 |
| Former Yugoslav Republic of Macedonia (FYROM) | 53.8 | 54.4 | 53.2 | 103.7 | 49 736 |
| Egypt | 55.3 | 54.2 | 56.4 | 112.1 | 40 719 |
| Poland | 56.6 | 56.2 | 57.0 | 81.0 | 59 329 |
| Cyprus | 58.6 | 58.7 | 58.5 | 98.7 | 21 090 |
| Croatia | 58.8 | 59.5 | 58.0 | 104.5 | 69 065 |
| Germany | 60.6 | 60.6 | 60.7 | 92.7 | 128 834 |
| Malta | 62.3 | 62.3 | 62.3 | 104.9 | 49 533 |
| Netherlands | 62.3 | 62.3 | 62.4 | 105.3 | 89 905 |
| Austria | 62.6 | 63.0 | 62.2 | 113.1 | 20 727 |
| Hungary | 65.4 | 66.6 | 64.2 | 103.2 | 22 946 |
| Greece | 65.6 | 65.8 | 65.5 | 97.8 | 128 610 |
| Italy | 67.0 | 66.3 | 67.7 | 107.3 | 219 336 |
| Total Overseas Born | 44.8 | 44.5 | 45.2 | 99.1 | 5 816 407 |
| Australia | 33.3 | 32.3 | 34.3 | 99.2 | 16 138 849 |
| Total | 36.8 | 36.0 | 37.6 | 99.2 | 21 955 256 |
|
| (a) Top 50 countries of birth (excluding Australia). Sorted by median age (persons) lowest to highest. |
| (b) Estimates for 2008-09 are preliminary - see paragraphs 9-10 of the Explanatory Notes. |
| (c) Males per 100 females. |
 Print Page
 Print All