|
|
NOTES
INTRODUCTION
This article presents a brief overview of the level and types of private health insurance cover of the Australian population by general population and health characteristics.
DATA SOURCES
This article uses data from the 2004-05 ABS National Health Survey (NHS), previous National Health Surveys from 1995 and 2001, and the 1998 Private Health Insurance Survey conducted by the ABS (as a supplement to the Monthly Population Survey). The article also draws on data from the Private Health Insurance Administration Council (PHIAC) which compiles the data from administrative membership records supplied by private health insurance providers.
Data about private health insurance shown in this article relate to persons aged 15 years and over. The National Health Surveys and the Private Health Insurance Survey are household surveys which exclude homeless and institutionalised people.
INQUIRIES
For further information about these and related statistics, contact the National Information and Referral Service on 1300 135 070 or email client.services@abs.gov.au. |
PRIVATE HEALTH INSURANCE
At 30 June 2006 private health insurance was offered by 38 registered health insurers, giving a voluntary option to all Australians for private funding of their hospital and ancillary health treatment. It supplements the Medicare system, which provides a tax-financed public system that is available to all Australians. Depending on the type of cover purchased, private health insurance provides cover against all or part of hospital theatre and accommodation costs in either a public or private hospital, medical costs in hospital and costs associated with a range of services not covered under Medicare, including private dental services, optical, chiropractic, home nursing, ambulance and natural therapies.
COVERAGE
- In the 2004-05 NHS, 51% of Australians aged 15 years and over reported having private health insurance, 47% had hospital cover (with or without ancillary cover) and 41% had ancillary cover (with or without hospital cover).
- In 2004-05, of those aged 15 years and over without private health insurance 46% were covered by a government health concession or entitlement card (footnote 1). In total, 73% of persons aged 15 years and over had private insurance or were covered by a government health card.
- NHS results for 2004-05 were similar to PHIAC data which show 45% of the population aged 15 years and over had hospital cover at June 2005 (PHIAC 2006). Differences between NHS and PHIAC data are due to the different methodologies used to collect them (footnote 2).
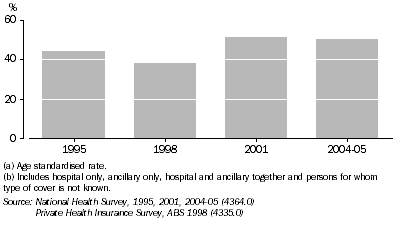
- The proportion with private health insurance rose from 38% in 1998 to 51% in 2001 (after adjusting for age differences) (footnote 3). This reflects the introduction of the Australian Government's 30% rebate on private health insurance in 1999, and the Government's Lifetime Health Cover Policy in 2000 (footnote 4) (DoHA 2006).
- There was little change in the overall coverage of health insurance between 2001 (51%) and 2004-05 (50%) (after adjusting for age differences).
Private health insurance 1995 to 2004-05 (a) (b)
AGE AND SEX
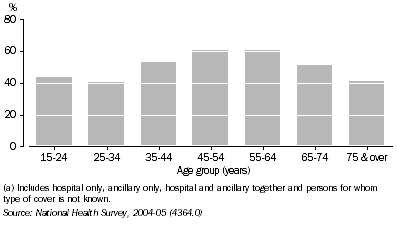
- The proportion of people covered by private health insurance differs by age group. The highest level of private health insurance coverage in 2004-05 was in the 45-54 and 55-64 years age groups (both around 61%), while the lowest (41%) was in the 25-34 and 75 years and over age groups.
Persons with private health insurance by age group (a)
- Coverage among older people is augmented by government concessions. Most (91%) people aged 65 years and over reported they had a government health concession card.
- People in the 25 to 34 years age group were least likely to be covered by private health insurance or a health concession card. NHS data shows that a larger proportion of males (46%) than females (35%) in this age group did not have private health insurance or a concession card.
- A comparison with 2001 data shows that the proportion of people aged 45-54 and 35-44 years with private health insurance has decreased by around four percentage points between 2001 and 2004-05, while the coverage of older age groups has increased by around four percentage points.
- The change over time in the proportion of people with private health insurance in middle age groups was higher for females than males. The proportion of males with private health insurance fell in the 35-44 and 45-54 years age groups by two and four percentage points respectively, with no change in the 55-64 years age group. However for females, coverage fell by five percentage points in the 35-44 and 45-54 years age groups and increased six percentage points in the 55-64 years age group.
Persons with private health insurance by sex
Source: National Health Survey 2001, 2004-05
TYPE OF COVER
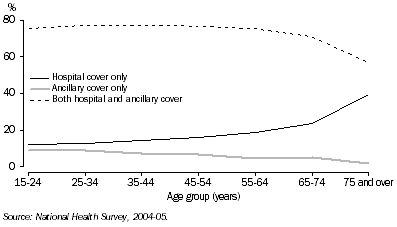
- In 2004-05 most people with private health insurance had both hospital and ancillary cover (75% of the insured population). Hospital and ancillary together was the most common form of cover across all insured age groups, from 57% in the 75 years and over age group, to 77% in the 25-34, 35-44 and 45-54 years age groups.
- Hospital only cover was more commonly reported by people in older age groups (40% in the 75 years and over age group and 24% in the 65-74 years age group), while ancillary only cover was most common in younger age groups (9% in both the 15-24 and 25-34 years age groups) for those with private health insurance.
Type of cover of insured population, 2004-05
REASONS FOR INSURING/NOT INSURING
- In the 2004-05 NHS the most commonly reported reasons for having private health insurance were security/protection or peace of mind (43% of those with private health insurance), shorter wait for treatment or concern over public hospital waiting lists (23%), and having always had it, parents pay for it, or as a condition of their job (23%).
- Almost two thirds (64%) of those without private health insurance reported not insuring because they could not afford it or it was too expensive (an increase of five percentage points from 2001). This was the most commonly reported reason for not having private health insurance across all age groups and income groups.
INCOME CHARACTERISTICS
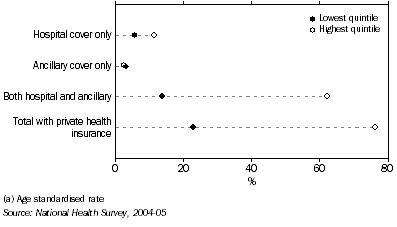
- The likelihood of having private health insurance increases with income. In 2004-05, 23% of persons in the lowest income quintile (footnote 5) had private health insurance in 2004-05 compared with 76% of those in the highest income quintile (after adjusting for age differences).
- Similarly, 28% of persons living in the most socioeconomically disadvantaged areas had private health insurance, compared with 72% of those living in the least socioeconomically disadvantaged areas (as measured by being in the lowest and highest quintiles of the index of disadvantage respectively) (footnote 6). (These data have been adjusted for age differences).
- The likelihood of having combined hospital and ancillary cover is strongly related to income whereas hospital only and ancillary only cover do not significantly differ by income group. Of those in the highest income quintile, 62% had both hospital and ancillary insurance, compared to 14% of those in the lowest income quintile (after adjusting for age differences).
Type of cover by income, 2004-05 (a)
OTHER CHARACTERISTICS
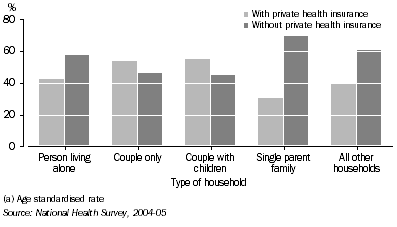
- Rates of private health insurance were highest among couples with children (55%) and couple only (54%) household types (after adjusting for age differences). Single parent family households were least likely to have private health insurance (30%). They were the most likely to have a health concession card (60%) (after adjusting for age differences).
- Employed persons aged 15-64 years, were much more likely to have private health insurance (56%) than those who were unemployed (22%) (after adjusting for age differences). In contrast, 59% of unemployed persons in this age group reported having a government health concession or entitlement card, compared with just 11% of employed persons.
Insurance status by household structure, 2004-05 (a)
HEALTH STATUS
- In 2004-05, 62% of those with private health insurance reported they were in excellent or very good health. An estimated 35% of those who reported their health was fair or poor had private health insurance.
- Of those people aged 18 years or more categorised as having high/very high levels of psychological distress (footnote 7), 35% had private health insurance compared to 53% of adults classified to moderate or low levels of distress (after adjusting for age differences).
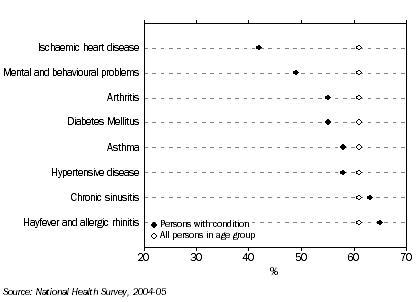
- People aged 15 years and over reporting long term conditions (footnote 8) such as ischaemic heart disease (footnote 9), mental or behavioural problems, diabetes mellitus or arthritis were less likely to have private health insurance in 2004-05 than those who did not have the condition.
- For example, whereas 61% of all people in the 45-64 years age group had private health insurance, 42% of those with ischaemic heart disease, 49% of those with long-term mental and behavioural problems and 55% of those with arthritis or diabetes were privately insured. In contrast, those aged 45 to 64 years with sinusitis or hayfever were more likely to have private health insurance (63% and 65% respectively). Taking into account those with a government health concession or entitlement card, over 80% of those in this age group with the conditions shown were covered by insurance and/or a card.
Persons aged 45-64 years with selected long-term conditions, 2004-05
RISK FACTORS
- In most age groups, adults who smoke and those who drink alcohol at a high risk level (footnote 10) were less likely to have private health insurance than other people in the same age groups.
- Of the estimated 3.2 million Australians aged 18 years and over who smoked daily (footnote 11) in 2004-05, 32% had private health insurance. In all age groups, the proportion of daily smokers with private health insurance was at least 20 percentage points lower than that of non-smokers. The largest difference was in the 45 to 54 year age group, where 39% of daily smokers had private health insurance compared with 68% of non-smokers.
- In all age groups less than 65 years people classified as high risk alcohol consumers were less likely to have private health insurance than those who consumed at lower risk levels or who did not drink alcohol. The largest difference was in the 35 to 44 and 45 to 54 year age groups, where the proportion of high risk drinkers with private health insurance was 13 percentage points lower than the proportion of other people in the age group. For the 65 years and over age group the insurance levels of high risk drinkers were similar to others in the age group.
- An estimated 47% of the population aged 15 years and over were classified as overweight or obese (footnote 12). Just under half (49%) of these people had private health insurance, compared with 53% of persons who were an acceptable weight or underweight (after adjusting for age differences).
PUBLIC HOSPITAL ADMISSIONS
- In 2004-05 20% of people with private hospital insurance who were admitted to hospital in the previous 12 months reported their most recent admission had been as a public (Medicare) patient.
- The main reasons reported by insured people for admission to hospital as a public patient were that the choice had been made by others (26%) or the choice was made on doctor's advice or their doctor had booked (23%).
ANCILLARY SERVICE USE
- By taking out ancillary cover, Australians can insure to reclaim (some) costs of dental care and services provided by health professionals other than doctors (e.g. optical).
- Results from the 2004-05 NHS show that 24% of those with ancillary cover had consulted a dentist or other health professional (footnote 13) in the previous two weeks, compared with 16% of those who did not have ancillary cover (after adjusting for age differences).
HEALTH CARE FUNDING
- Private health insurance funds provided 21% of the total non-government health sector funding in 2004-05. Just under half (48%) of this was spent on private hospitals, along with dental services (12%), administration (10%), and medical services (10%). Benefits paid by the funds in 2004-05 were up 7% from 2003-04.
- An estimated $626 per insured person, was spent by private health insurance funds in 2004-05 (AIHW 2006).
FOOTNOTES
1. Government issued cards which entitle the card holder, and in some cases their dependents, to a variety of health benefits or concessions (eg medical care, hospital treatment/accommodation, supply of pharmaceuticals) free of charge or at reduced rates. Included are:
- any cards from the Department of Veterans' Affairs (DVA);
- Health Care Card (including the low income health care card);
- Pensioner Concession Card;
- Commonwealth Seniors Health Card.
As shown below, in 2004-05 almost all persons aged 65 and over reported having at least one of these cards.
2. Statistics available from the Private Health Insurance Administration Council (PHIAC) are compiled from data provided by insurance funds. PHIAC statistics provide hospital insurance tables (which include both hospital and ancillary and hospital only cover) and ancillary tables (which include both hospital and ancillary and ancillary only cover). ABS data are provided as mutually exclusive categories of both hospital and ancillary, hospital only and ancillary only. These categories are regrouped in order to provide comparisons with PHIAC data, e.g. the ABS both hospital and ancillary and hospital only categories were combined in order to compare ABS survey data with PHIAC's hospital insurance tables. Despite the different sources of the data, the overall levels and types of cover across age groups described by the NHS were similar to those shown in PHIAC data. Back
| 3. Since many health characteristics are age-related, the age profile of the populations being compared needs to be considered when interpreting the data. To account for the differences in age structure, where noted, some estimates within this publication are shown as age standardised percentages, using the Australian estimated resident population at June 30 2001 as the standard population. For further detail, see the Explanatory Notes of the National Health Survey: Summary of Results, 2004-05 (cat. no. 4364.0). Back |
4. Policies relating to private health insurance introduced in recent years by the Australian Government include:
- The Private Health Insurance Incentive Scheme (PHIIS), introduced on 1 July 1997, offering subsidies for insuring (to low income earners) or tax penalties for not insuring (for high income earners).
- The Private Health Insurance Incentives Act 1998 (30% rebate), introduced on 1 Jan 1999, replacing the PHIIS subsidy for low income earners. From April 2005, the rebate for persons aged 65 -69 years increased to 35% and for persons aged 70 years and over it increased to 40%. The 1% Medicare levy surcharge from the PHIIS increased to 1.5% of taxable income and since October 1997 a further surcharge of 1% has been levied on higher income earners (single people with incomes over $50,000 and couples earning over $100,000) without private health insurance.
- The Lifetime Health Cover scheme was introduced on 15 July 2000. This scheme provides incentives to people who purchase hospital cover before they turn 30 years old, and by maintaining their membership, will pay lower premiums throughout their lifetime relative to people who delay joining. Back
5. Income quintiles are groupings that result from ranking all reported incomes in ascending order then dividing those incomes into five equal groups, each comprising 20% of the reported income values. Income quintile categories in this publication are calculated from the equivalised income of income units. An income unit (or household) may comprise one person or group of related persons (de facto or registered marriage or parent/dependent child relationship) within a household whose command over income is assumed to be shared. An income unit may therefore include the partner (for couples), all children aged less than 15 years, and children aged 15-24 years provided they are unmarried, full-time students and do not have dependents of their own. In the 2004-05 NHS income unit income is the sum of the respondent's cash income, the cash income of their spouse/partner (where applicable) and the cash income of children aged 15 years or more who are part of that unit. Back
6. The Index of disadvantage is one of four Socio Economic Indexes for Areas (SEIFAs) compiled by ABS following each Census of Population and Housing. The indexes are compiled from various characteristics of persons resident in particular areas; the index of disadvantage summarises attributes such as low income, low educational attainment, high unemployment and jobs in relatively unskilled occupations. For further information about SEIFAs see Chapter 6 of the 2004-05 National Health Survey: Users' Guide. Back
7. Derived from the Kessler Psychological Distress Scale -10 items (K10). This is a scale of non-specific psychological distress based on 10 questions about negative emotional states in the 4 weeks prior to interview. The K10 is scored from 10 to 50, with higher scores indicating a higher level of distress; low scores indicate a low level of distress. In the 2004-05 NHS, the K10 questions were asked of adults aged 18 years and over. For more information, see Australian Bureau of Statistics Information Paper: Use of Kessler Psychological Distress Scale in ABS Health Surveys, 2003 (cat. no. 4817.0.55.001) Back
8. A long term medical condition is a medical condition (illness, injury or disability) which the survey respondent has reported as lasting for six months or more, or which the respondent expects to last for six months or more. Back
9. Ischaemic heart disease is a disease of the blood vessels supplying the heart muscle. It is characterised by a reduction in the supply of blood to the heart resulting in angina (chest pain due to shortage of oxygen), especially when a large area of the heart is affected Back
10. Alcohol risk levels were derived from the average daily consumption of alcohol in the seven days prior to interview and are grouped into relative risk levels as defined by the National Health and Medical Research Council (NHMRC) as follows:
ALCOHOL RISK LEVEL(a), CONSUMPTION PER DAY
|
Risk level
| Males
| Females
|
| Low risk | 50 mLs or less | 25 mLs or less |
| Risky | More than 50 mLs, up to 75 mLs | More than 25 mLs, up to 50 mLs |
| High risk | More than 75 mLs | More than 50 mLs |
|
(a) One standard drink contains 12.5mls of alcohol. Back
11. A current daily smoker is an adult who reported that they currently smoked one or more cigarettes, cigars or pipes per day. Back
12. Body Mass Index (BMI) is calculated from reported height and weight information, using the formula weight (kg) divided by the square of height (m). To produce a measure of the prevalence of overweight or obesity in adults, BMI values are grouped according to the table below which allows categories to be reported against both the World Health Organization (WHO) and National Health and Medical Research Council (NHMRC) guidelines.
BODY MASS INDEX GROUPS
|
| Underweight | Less than 18.5 |
| Normal range | 18.5 to less than 20.0
20.0 to less than 25.0 |
| Overweight | 25.0 to less than 30.0 |
| Obese | 30.0 and greater |
|
13. 10. In the 2004-05 NHS, the category of other health professionals refers to the following:
Aboriginal health worker
Accredited counsellor
Acupuncturist
Alcohol and drug worker
Audiologist/audiometrist
Chemist (advice only)
Chiropodist/podiatrist | Chiropractor
Dietitian/nutritionist
Herbalist
Hypnotherapist
Naturopath
Nurse
Occupational therapist | Optician/optometrist
Osteopath
Physiotherapist/hydrotherapist
Psychologist
Social worker/welfare officer
Speech therapist/pathologist
Traditional healer |
LIST OF REFERENCES
Australian Bureau of Statistics 2006, National Health Survey: Summary of Results, Australia 2004-05, cat. no. 4364.0, ABS, Canberra.
Australian Bureau of Statistics 2006a, National Health Survey, Australia 2004-05, unpublished data
Australian Bureau of Statistics 2003, Private Health Insurance, Australia 2001, cat. no. 4815.0.55.001, ABS, Canberra.
Australian Bureau of Statistics 2002, National Health Survey: Summary of Results, Australia 2001, cat. no. 4364.0, ABS, Canberra.
Australian Bureau of Statistics 1999, Health Insurance Survey, Australia 1998, cat. no. 4335.0, ABS, Canberra.
Australian Bureau of Statistics 1998, National Health Survey, Private Health Insurance, Australia 1995, cat. no. 4334.0, ABS, Canberra.
Australian Institute of Health and Welfare (AIHW) 2006, Health expenditure Australia 2004-05, AIHW Cat. No. HWE 35, (Health and Welfare Expenditure Series No. 28) AIHW, Canberra.
Department of Health and Ageing (DoHA) 2006, Membership Statistics, viewed September 2006,
http://www.health.gov.au/internet/wcms/publishing.nsf/content/private-1
Private Health Insurance Administrative Council (PHIAC) 2006, Private Health Insurance for Consumers, viewed August 2006,
http://www.phiac.gov.au/statistics/membershipcoverage/hosquar.htm
|
|
 Print Page
 Print All