INTERNATIONAL STUDENTS CONTRIBUTING TO NOM
The ABS Demography program's main interest in international students in Australia is in the impact they have on NOM and hence, the Australian population. International students who contribute to NOM are those travelling on temporary student visas on arrival in, or departure from, Australia.
There are large differences between student visa arrivals and student visa departures for the five year period reviewed in this article, from 2004-05 to 2008-09. Two major factors contribute to the disparity between student arrivals and student departures which are used to calculate the net figure (NOM) for any given period. The first is the result of the time lag effect of a student's course duration. For example, a student arriving today will not necessarily become a NOM departure until the course has ended, in two, three, or four years' time. Thus, when there is a large increase experienced in student arrivals, there will be an interval before a consequential increase in student departures may be experienced. The second factor is that the circumstances of students can also change at the end of their study time whereby they apply for a different visa whilst onshore. Thus it is unlikely to be able to calculate an exact net figure (NOM) for each visa subclass, particularly for some temporary visa holders such as students - see Data limitations from earlier in this chapter.
The main growth in NOM over the five year period ending June 2009 was in the number of student arrivals (see table 6.3). In 2008-09, there were 153,600 student NOM arrivals and 31,200 student NOM departures. This equates to a net contribution (NOM) of 122,400 students being added to Australia's population for the year. In 2004-05 the comparative numbers for students were 66,500 NOM arrivals and 21,300 NOM departures, for a student NOM of 45,300 persons. While the number of student NOM arrivals more than doubled when 2004-05 and 2008-09 were compared, NOM departures of students only increased by 47% over the same period. In percentage terms, NOM arrivals of students represented 30% of all NOM arrivals in 2008-09 while NOM departures of students represented 14% of all NOM departures. The comparative student proportions for 2004-05 were lower at 19% for NOM arrivals and 11% for NOM departures.
6.3 NOM(a), Student, temporary and total visas(b) - Australia - 2004-05 to 2008-09 |
|
 | STUDENT VISAS(b) | ALL TEMPORARY VISAS(b) | ALL VISAS(b) |
| NOM arrival | NOM departure | NOM | NOM arrival | NOM departure | NOM | NOM arrival | NOM departure | NOM |
NUMBER(no) |
|
| 2004-05 | 66 546 | 21 296 | 45 250 | 141 507 | 59 507 | 82 000 | 341 395 | 198 892 | 142 503 |
| 2005-06 | 73 590 | 26 253 | 47 337 | 162 278 | 65 372 | 96 906 | 377 882 | 206 430 | 171 452 |
| 2006-07 | 104 638 | 25 743 | 78 895 | 205 571 | 62 513 | 143 058 | 437 510 | 204 686 | 232 824 |
| 2007-08 | 135 165 | 26 423 | 108 742 | 263 757 | 77 229 | 186 528 | 501 339 | 224 007 | 277 332 |
| 2008-09 | 153 586 | 31 223 | 122 363 | 279 166 | 89 950 | 189 216 | 519 785 | 219 921 | 299 864 |
PROPORTION OF ALL NOM ARRIVALS, NOM DEPARTURES AND NOM(%) |
|
| 2004-05 | 19.5 | 10.7 | 31.8 | 41.4 | 29.9 | 57.5 | 100.0 | 100.0 | 100.0 |
| 2005-06 | 19.5 | 12.7 | 27.6 | 42.9 | 31.7 | 56.5 | 100.0 | 100.0 | 100.0 |
| 2006-07 | 23.9 | 12.6 | 33.9 | 47.0 | 30.5 | 61.4 | 100.0 | 100.0 | 100.0 |
| 2007-08 | 27.0 | 11.8 | 39.2 | 52.6 | 34.5 | 67.3 | 100.0 | 100.0 | 100.0 |
| 2008-09 | 29.5 | 14.2 | 40.8 | 53.7 | 40.9 | 63.1 | 100.0 | 100.0 | 100.0 |
GROWTH ON PREVIOUS YEAR(%) |
|
| 2005-06 | 10.6 | 23.3 | 4.6 | 14.7 | 9.9 | 18.2 | 10.7 | 3.8 | 20.3 |
| 2006-07 | 42.2 | -1.9 | 66.7 | 26.7 | -4.4 | 47.6 | 15.8 | -0.8 | 35.8 |
| 2007-08 | 29.2 | 2.6 | 37.8 | 28.3 | 23.5 | 30.4 | 14.6 | 9.4 | 19.1 |
| 2008-09 | 13.6 | 18.2 | 12.5 | 5.8 | 16.5 | 1.4 | 3.7 | -1.8 | 8.1 |
AVERAGE ANNUAL GROWTH RATE(%) |
|
| 2004-05 to | | | | | | | | | |
| 2008-09 | 23.3 | 10.0 | 28.2 | 18.5 | 10.9 | 23.2 | 11.1 | 2.5 | 20.4 |
|
| (a) All net overseas migration (NOM) estimates in this table are final and based on the '12/16 month rule' methodology. The '12/16 month rule' has only been applied for Australia's official estimated resident population (ERP) back to September quarter 2006. Data presented in this table will not align with NOM or ERP prior to this time. |
| (b) The visa category information represents the number of visas based on the visa type at the time of a traveller's specific movement. It is this specific movement that has been used to calculate NOM. |
International students by age and sex
The age structure of student visa holders contributing to NOM is different to the age structure of all temporary visa holders and to that of total NOM. Student visa holders are a subgroup of the temporary visa group and the temporary visa group is a subgroup of total NOM. The remaining composition of total NOM is non-temporary visa holders which includes those travelling on permanent visas, New Zealand citizens, Australian citizens and 'other' persons travelling (e.g. non-Australian citizens who are permanent residents and those on onshore and unknown visas).
6.4 NOM(a), temporary and student visa population structures(b)(c), Age and sex, Australia
- 2008-09
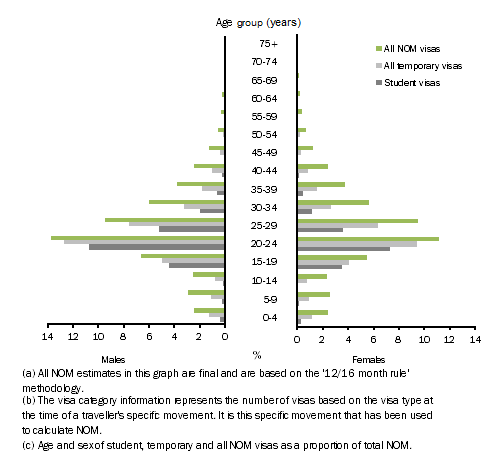
During 2008-09, the net of student arrivals minus student departures (a student NOM of 122,400 persons) was the largest individual sub-group contributing to NOM (299,900 persons). Not surprisingly, student visa holders were young, with 93% (113,600 persons) of all students being in the 15 to 34 years age group. In all, travellers on student visas contributed 65% of all temporary NOM and 41% of the total NOM figure for the year. The graph above (figure 6.4) shows the contribution each sub-group made (by age and sex) to the overall total NOM figure.
Students were also present in the ages below 15 years of age. Mainly these children are secondary visa holders, accompanying a parent travelling on a primary student visa. In 2008-09, these children represented around 3% of student NOM visa holders.
There were more males travelling on student visas than females. Final 2008-09 data show that there was a net of 71,400 male student visa holders added to Australia's population in that year. In comparison, there was a smaller net of 51,000 female student visa holders. This equates to 58% of student NOM being male and 42% being female.
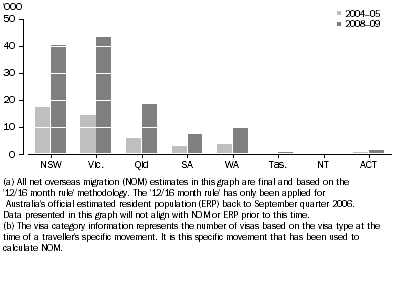
International students by State and Territory
When 2004-05 and 2008-09 were compared, all states and territories recorded increased growth from the net contribution of persons travelling on international student visas. Victoria recorded the highest net contribution of international students in 2008-09 (43,600 students) compared with New South Wales who had the highest in 2004-05 (17,300 students). For the two periods being compared, the Northern Territory recorded the highest proportional increase (367%), however, the numbers involved were small. Queensland recorded the next highest proportional increase (215%, increasing from 5,800 in 2004-05 to 18,300 students in 2008-09), followed by Victoria (205%, increasing from 14,300 students to 43,600 students) and Western Australia (181%, increasing from 3,600 students to 10,000 students). For Australia, the net contribution to NOM of international students increased 170%, up from 45,300 in 2004-05 to 122,400 in 2008-09.
6.5 NOM(a), Student visas(b), States and territories
- 2004-05 and 2008-09
International students by Visa subclasses
In the period 2004-05 to 2008-09, there were seven main student visa subclasses making a net contribution to student NOM (see table 6.6). The largest student visa group contributing to NOM was the higher education subclass. During the first four years of the five year period, the higher education subclass contributed over 50% of student NOM, peaking at 58% in 2005-06. By 2008-09, while still remaining the largest of all the subclasses, the higher education subclass had fallen to 44% of student NOM.
6.6 NOM(a), Student visa subclass(b) - 2004-05 to 2008-09 |
|
| NUMBER OF STUDENT VISAS | PROPORTION OF ALL STUDENT VISAS |
| 2004-05 | 2005-06 | 2006-07 | 2007-08 | 2008-09 | 2004-05 | 2005-06 | 2006-07 | 2007-08 | 2008-09 |
| Student visa subclass(b) | no. | no. | no. | no. | no. | % | % | % | % | % |
STUDENT NOM ARRIVALS |
|
| 570-ELICOS(c) | 6 093 | 7 910 | 9 785 | 10 360 | 12 031 | 9.2 | 10.7 | 9.4 | 7.7 | 7.8 |
| 571-Schools | 6 496 | 6 644 | 9 446 | 10 884 | 7 136 | 9.8 | 9.0 | 9.0 | 8.1 | 4.6 |
| 572-VET(d) | 7 986 | 10 493 | 19 970 | 31 419 | 53 568 | 12.0 | 14.3 | 19.1 | 23.2 | 34.9 |
| 573-Higher education(e) | 32 746 | 42 037 | 57 943 | 73 149 | 72 081 | 49.2 | 57.1 | 55.4 | 54.1 | 46.9 |
| 574-Postgraduate research(e) | 9 354 | 2 295 | 2 633 | 3 106 | 4 013 | 14.1 | 3.1 | 2.5 | 2.3 | 2.6 |
| 575-Non-award(f) | 1 697 | 1 622 | 1 582 | 2 555 | 1 918 | 2.6 | 2.2 | 1.5 | 1.9 | 1.2 |
| 576-AusAID/Defence | 1 758 | 2 052 | 2 364 | 2 248 | 2 008 | 2.6 | 2.8 | 2.3 | 1.7 | 1.3 |
| Other student visas | 416 | 537 | 915 | 1 444 | 831 | 0.6 | 0.7 | 0.9 | 1.1 | 0.5 |
| All students | 66 546 | 73 590 | 104 638 | 135 165 | 153 586 | 100.0 | 100.0 | 100.0 | 100.0 | 100.0 |
STUDENT NOM DEPARTURES |
|
| 570-ELICOS(c) | 506 | 596 | 753 | 782 | 884 | 2.4 | 2.3 | 2.9 | 3.0 | 2.8 |
| 571-Schools | 1 245 | 1 653 | 1 694 | 1 865 | 2 090 | 5.8 | 6.3 | 6.6 | 7.1 | 6.7 |
| 572-VET(d) | 3 082 | 3 412 | 3 369 | 4 064 | 5 555 | 14.5 | 13.0 | 13.1 | 15.4 | 17.8 |
| 573-Higher education(e) | 9 005 | 14 781 | 16 026 | 15 629 | 18 120 | 42.3 | 56.3 | 62.3 | 59.1 | 58.0 |
| 574-Postgraduate research(e) | 4 960 | 3 329 | 1 446 | 1 189 | 1 298 | 23.3 | 12.7 | 5.6 | 4.5 | 4.2 |
| 575-Non-award(f) | 251 | 298 | 308 | 376 | 501 | 1.2 | 1.1 | 1.2 | 1.4 | 1.6 |
| 576-AusAID/Defence | 1 465 | 1 820 | 1 832 | 2 109 | 2 243 | 6.9 | 6.9 | 7.1 | 8.0 | 7.2 |
| Other student visas | 782 | 364 | 315 | 409 | 532 | 3.7 | 1.4 | 1.2 | 1.5 | 1.7 |
| All students | 21 296 | 26 253 | 25 743 | 26 423 | 31 223 | 100.0 | 100.0 | 100.0 | 100.0 | 100.0 |
STUDENT NOM |
|
| 570-ELICOS(c) | 5 587 | 7 314 | 9 032 | 9 578 | 11 147 | 12.3 | 15.5 | 11.4 | 8.8 | 9.1 |
| 571-Schools | 5 251 | 4 991 | 7 752 | 9 019 | 5 046 | 11.6 | 10.5 | 9.8 | 8.3 | 4.1 |
| 572-VET(d) | 4 904 | 7 081 | 16 601 | 27 355 | 48 013 | 10.8 | 15.0 | 21.0 | 25.2 | 39.2 |
| 573-Higher education(e) | 23 741 | 27 256 | 41 917 | 57 520 | 53 961 | 52.5 | 57.6 | 53.1 | 52.9 | 44.1 |
| 574-Postgraduate research(e) | 4 394 | -1 034 | 1 187 | 1 917 | 2 715 | 9.7 | -2.2 | 1.5 | 1.8 | 2.2 |
| 575-Non-award(f) | 1 446 | 1 324 | 1 274 | 2 179 | 1 417 | 3.2 | 2.8 | 1.6 | 2.0 | 1.2 |
| 576-AusAID/Defence | 293 | 232 | 532 | 139 | -235 | 0.6 | 0.5 | 0.7 | 0.1 | -0.2 |
| Other student visas | -366 | 173 | 600 | 1 035 | 299 | -0.8 | 0.4 | 0.8 | 1.0 | 0.2 |
| All students | 45 250 | 47 337 | 78 895 | 108 742 | 122 363 | 100.0 | 100.0 | 100.0 | 100.0 | 100.0 |
|
| (a) All net overseas migration (NOM) estimates in this table are final and based on the '12/16 month rule' methodology. The '12/16 month rule' has only been applied for Australia's official estimated resident population (ERP) back to September quarter 2006. Data presented in this table will not align with NOM or ERP prior to this time. |
| (b) The visa category information represents the number of visas based on the visa type at the time of a traveller's specific movement. It is this specific movement that has been used to calculate NOM. |
| (c) English Language Intensive Courses for Overseas Students. |
| (d) Vocational Education and Training. |
| (e) Due to legislative change, from 1 July 2004, the Masters by Coursework qualification moved from the Postgraduate Research Sector to the Higher Education Sector. |
| (f) Includes study abroad, foundation, bridging and other courses not leading to an Australian award. |
All educational subclasses varied their proportional representation of all students between 2004-05 and 2008-09. A comparison of 2004-05 and 2008-09 shows that with the exception of the vocational education and training (VET) subclass, the remaining subclasses decreased their proportional share of all student visas. The VET subclass was the only student visa group to increase its proportion of student NOM in each of the five years, increasing from 11% in 2004-05 to 39% in 2008-09.
The net increase in students using VET visas was in part due to the disparity between arrivals and departures. While the numbers of students arriving on VET visas grew strongly over the five year period (increasing nearly seven fold, from 8,000 persons in 2004-05 to 53,600 persons in 2008-09) the number of students departing on VET visas, increased at a slower rate (increasing nearly twice, from 3,100 persons in 2004-05 to 5,600 persons in 2008-09). Time lags in course durations and individuals changing to another visa whilst onshore are the most likely reason for this disparity - see
Data limitations from earlier in this chapter.
International students by country of birth
The source countries of birth for travellers arriving and departing Australia on student visas numbered over 200 countries. In 2008-09, the top 10 countries of birth contributed 83% of student NOM. As the majority of students are within this range of countries, the remainder of this section of analysis will focus on the top 10 countries of birth.
When 2004-05 and 2008-09 were compared, seven of the top 10 countries were contributors to the top 10 in both years (see table 6.7). In 2008-09, Nepal, Saudi Arabia and Mauritius were within the top 10 countries having replaced South Korea, Bangladesh and Hong Kong, which had been included in 2004-05.
In 2008-09, the number of student NOM arrivals exceeded the number of student NOM departures in all top 10 country of birth categories. There were 58 times more student NOM arrivals from Nepal (10,700 persons) than student NOM departures to Nepal (fewer than 200 persons). Similarly, there were 20 times more arrivals than departures for India-born. Course durations and changes to an individual's travel visa should be kept in mind when analysing student arrival and departure data - see
Data limitations from earlier in this chapter.
6.7 NOM(a), Student visas(b) - Country of birth(c) - 2004-05 and 2008-09 |
|
| NUMBER | PROPORTION |
| Student NOM arrivals | Student NOM departures | Student NOM | Student NOM arrivals | Student NOM departures | Student NOM |
| Country of birth(c) | no. | no. | no. | % | % | % |
2004-05 |
|
| China(d) | 15 931 | 2 323 | 13 608 | 23.9 | 10.9 | 30.1 |
| India | 9 553 | 666 | 8 887 | 14.4 | 3.1 | 19.6 |
| Korea, Republic of (South) | 4 208 | 1 518 | 2 690 | 6.3 | 7.1 | 5.9 |
| Malaysia | 4 275 | 1 823 | 2 452 | 6.4 | 8.6 | 5.4 |
| Bangladesh | 2 005 | 215 | 1 790 | 3.0 | 1.0 | 4.0 |
| Indonesia | 3 317 | 1 981 | 1 336 | 5.0 | 9.3 | 3.0 |
| Thailand | 2 729 | 1 594 | 1 135 | 4.1 | 7.5 | 2.5 |
| Hong Kong (SAR of China) | 2 860 | 1 757 | 1 103 | 4.3 | 8.3 | 2.4 |
| Sri Lanka | 1 210 | 161 | 1 049 | 1.8 | 0.8 | 2.3 |
| Vietnam | 1 300 | 336 | 964 | 2.0 | 1.6 | 2.1 |
| Other countries | 19 158 | 8 922 | 10 236 | 28.8 | 41.9 | 22.6 |
| All countries | 66 546 | 21 296 | 45 250 | 100.0 | 100.0 | 100.0 |
2008-09 |
|
| India | 45 199 | 2 244 | 42 955 | 29.4 | 7.2 | 35.1 |
| China(d) | 29 941 | 5 291 | 24 650 | 19.5 | 16.9 | 20.1 |
| Nepal | 10 697 | 183 | 10 514 | 7.0 | 0.6 | 8.6 |
| Vietnam | 6 808 | 772 | 6 036 | 4.4 | 2.5 | 4.9 |
| Malaysia | 5 529 | 2 050 | 3 479 | 3.6 | 6.6 | 2.8 |
| Thailand | 4 778 | 1 600 | 3 178 | 3.1 | 5.1 | 2.6 |
| Saudi Arabia | 4 006 | 836 | 3 170 | 2.6 | 2.7 | 2.6 |
| Indonesia | 4 655 | 2 122 | 2 533 | 3.0 | 6.8 | 2.1 |
| Sri Lanka | 2 680 | 205 | 2 475 | 1.7 | 0.7 | 2.0 |
| Mauritius | 2 354 | 125 | 2 229 | 1.5 | 0.4 | 1.8 |
| Other countries | 36 939 | 15 795 | 21 144 | 24.1 | 50.6 | 17.3 |
| All countries | 153 586 | 31 223 | 122 363 | 100.0 | 100.0 | 100.0 |
|
| (a) All net overseas migration (NOM) estimates in this table are final and based on the '12/16 month rule' methodology. The '12/16 month rule' has only been applied for Australia's official estimated resident population (ERP) back to September quarter 2006. Data presented in this table will not align with NOM or ERP prior to this time. |
| (b) The visa category information represents the number of visas based on the visa type at the time of a traveller's specific movement. It is this specific movement that has been used to calculate NOM. |
| (c) Top 10 countries of birth, based on travellers contributing to student NOM in 2004-05 and 2008-09. |
| (d) China (excludes SARs and Taiwan). |
In proportional terms, travellers from half of the top 10 countries of birth (based on 2008-09 student NOM) increased or maintained their net contribution to total NOM each year, for the five years ending 2008-09 (see table 6.8). For the remaining countries in the top 10, China, Malaysia, Saudi Arabia, Indonesia and Sri Lanka recorded annual fluctuations. In each case the number of people contributing to student NOM was higher in 2008-09 than in 2004-05.
6.8 NOM(a), Student visas(b) - Country of birth(c) - 2004-05 to 2008-09 |
|
| Country of birth(c) | 2004-05 | 2005-06 | 2006-07 | 2007-08 | 2008-09 |
NUMBER(no) |
|
| India | 8 887 | 11 772 | 23 232 | 33 252 | 42 955 |
| China(d) | 13 608 | 12 513 | 18 795 | 25 813 | 24 650 |
| Nepal | 188 | 681 | 3 618 | 7 286 | 10 514 |
| Vietnam | 964 | 1 299 | 2 118 | 4 271 | 6 036 |
| Malaysia | 2 452 | 1 712 | 2 520 | 3 510 | 3 479 |
| Thailand | 1 135 | 1 463 | 2 178 | 2 773 | 3 178 |
| Saudi Arabia | 425 | 719 | 1 151 | 3 226 | 3 170 |
| Indonesia | 1 336 | 1 100 | 1 719 | 2 160 | 2 533 |
| Sri Lanka | 1 049 | 1 622 | 2 321 | 2 739 | 2 475 |
| Mauritius | 335 | 588 | 821 | 1 832 | 2 229 |
| Other countries | 14 871 | 13 868 | 20 422 | 21 880 | 21 144 |
| All countries - total student NOM | 45 250 | 47 337 | 78 895 | 108 742 | 122 363 |
| All countries - total NOM | 142 503 | 171 452 | 232 824 | 277 332 | 299 864 |
PROPORTION OF STUDENT NOM(%) |
|
| India | 19.6 | 24.9 | 29.4 | 30.6 | 35.1 |
| China(d) | 30.1 | 26.4 | 23.8 | 23.7 | 20.1 |
| Nepal | 0.4 | 1.4 | 4.6 | 6.7 | 8.6 |
| Vietnam | 2.1 | 2.7 | 2.7 | 3.9 | 4.9 |
| Malaysia | 5.4 | 3.6 | 3.2 | 3.2 | 2.8 |
| Thailand | 2.5 | 3.1 | 2.8 | 2.6 | 2.6 |
| Saudi Arabia | 0.9 | 1.5 | 1.5 | 3.0 | 2.6 |
| Indonesia | 3.0 | 2.3 | 2.2 | 2.0 | 2.1 |
| Sri Lanka | 2.3 | 3.4 | 2.9 | 2.5 | 2.0 |
| Mauritius | 0.7 | 1.2 | 1.0 | 1.7 | 1.8 |
| Other countries | 32.9 | 29.3 | 25.9 | 20.1 | 17.3 |
| All countries - % of student NOM | 100.0 | 100.0 | 100.0 | 100.0 | 100.0 |
PROPORTION OF TOTAL NOM(%) |
|
| India | 6.2 | 6.9 | 10.0 | 12.0 | 14.3 |
| China(d) | 9.5 | 7.3 | 8.1 | 9.3 | 8.2 |
| Nepal | 0.1 | 0.4 | 1.6 | 2.6 | 3.5 |
| Vietnam | 0.7 | 0.8 | 0.9 | 1.5 | 2.0 |
| Malaysia | 1.7 | 1.0 | 1.1 | 1.3 | 1.2 |
| Thailand | 0.8 | 0.9 | 0.9 | 1.0 | 1.1 |
| Saudi Arabia | 0.3 | 0.4 | 0.5 | 1.2 | 1.1 |
| Indonesia | 0.9 | 0.6 | 0.7 | 0.8 | 0.8 |
| Sri Lanka | 0.7 | 0.9 | 1.0 | 1.0 | 0.8 |
| Mauritius | 0.2 | 0.3 | 0.4 | 0.7 | 0.7 |
| Other countries | 10.4 | 8.1 | 8.8 | 7.9 | 7.1 |
| All countries - % of total NOM | 31.8 | 27.6 | 33.9 | 39.2 | 40.8 |
|
| (a) All net overseas migration (NOM) estimates in this table are final and based on the '12/16 month rule' methodology. The '12/16 month rule' has only been applied for Australia's official estimated resident population (ERP) back to September quarter 2006. Data presented in this table will not align with NOM or ERP prior to this time. |
| (b) The visa category information represents the number of visas based on the visa type at the time of a traveller's specific movement. It is this specific movement that has been used to calculate NOM. |
| (c) Top 10 countries of birth, based on travellers contributing to student NOM in 2008-09. |
| (d) China (excludes SARs and Taiwan). |
For those travelling on student visas, people born in India and China were the main contributors to student NOM. Together they contributed around 50% or over for each year between 2004-05 and 2008-09. China was the highest contributor in 2004-05 and 2005-06, at 30% and 26% respectively. People born in India recorded the highest proportion of travellers for the period 2006-07 to 2008-09, increasing from 29% to 35%.
In 2008-09, India-born travellers on student visas contributed 14% of total NOM (up from 6% in 2004-05) while China-born travellers on student visas contributed 8% in 2008-09 (down from 10% in 2004-05). The remaining top 10 countries made a combined net contribution to NOM of 11% in 2008-09 and 6% in 2004-05. Overall, student NOM increased its net contribution to total NOM to 41% in 2008-09, up from 32% in 2004-05.
Growth rates by country of birth
Nepal-born travellers on student visas showed the highest growth on a year to year basis, with a peak growth of 431% between 2005-06 and 2006-07 (see table 6.9). While most countries recorded positive growth on a yearly basis, there were countries that had the occasional negative growth. For example, Malaysia fell to -30% between 2004-05 and 2005-06, while Sri Lanka fell to -10% between 2007-08 and 2008-09. Between 2007-08 and 2008-09, just over half of the top 10 countries recorded the lowest annual percentage growth of the four year period.
All of the top 10 countries of birth recorded positive average annual growth rates. The average annual growth rate for Nepal-born was the highest recorded over the period ending June 2009 (174%), followed by Saudi Arabia (65%) and Mauritius (61%). It should be noted that the countries recording the highest annual growth rates were not the countries making the highest numeric contribution to student NOM. While India and China were the two top countries numerically over the period, India had an average annual growth rate of 48% (mid range) and China had a growth rate of 16% (third lowest). The average annual growth rate for student NOM was 28% while the average annual growth rate for total NOM was 20%.
6.9 NOM(a), Student visas(b) - Country of birth, Annual growth and average annual growth rate(c) - 2005-06 to 2008-09 |
|
| GROWTH ON PREVIOUS YEAR | AVERAGE ANNUAL GROWTH RATE |
| 2005-06 | 2006-07 | 2007-08 | 2008-09 | 2004-05 to 2008-09 |
| Country of birth(c) | % | % | % | % | % |
|
| India | 32.5 | 97.3 | 43.1 | 29.2 | 48.3 |
| China(d) | -8.0 | 50.2 | 37.3 | -4.5 | 16.0 |
| Nepal | 262.2 | 431.3 | 101.4 | 44.3 | 173.5 |
| Vietnam | 34.8 | 63.0 | 101.7 | 41.3 | 58.2 |
| Malaysia | -30.2 | 47.2 | 39.3 | -0.9 | 9.1 |
| Thailand | 28.9 | 48.9 | 27.3 | 14.6 | 29.4 |
| Saudi Arabia | 69.2 | 60.1 | 180.3 | -1.7 | 65.3 |
| Indonesia | -17.7 | 56.3 | 25.7 | 17.3 | 17.3 |
| Sri Lanka | 54.6 | 43.1 | 18.0 | -9.6 | 23.9 |
| Mauritius | 75.5 | 39.6 | 123.1 | 21.7 | 60.6 |
| Other countries | -6.7 | 47.3 | 7.1 | -3.4 | 9.2 |
| All countries - student NOM | 4.6 | 66.7 | 37.8 | 12.5 | 28.2 |
| All countries - total NOM | 20.3 | 35.8 | 19.1 | 8.1 | 20.4 |
|
| (a) All net overseas migration (NOM) estimates in this table are final and based on the '12/16 month rule' methodology. The '12/16 month rule' has only been applied for Australia's official estimated resident population (ERP) back to September quarter 2006. Data presented in this table will not align with NOM or ERP prior to this time. |
| (b) The visa category information represents the number of visas based on the visa type at the time of a traveller's specific movement. It is this specific movement that has been used to calculate NOM. |
| (c) Top 10 countries of birth, based on travellers contributing to student NOM in 2008-09. |
| (d) China (excludes SARs and Taiwan). |
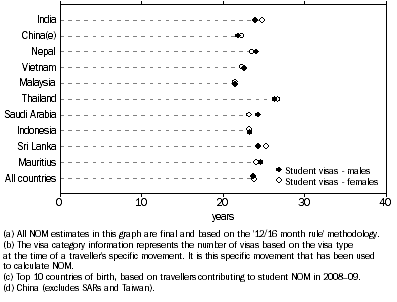
Median age by country of birth
Travellers making a net contribution to student NOM while residing in Australia are usually younger than travellers contributing to total NOM. In 2008-09, the median age of people travelling on student visas was 23.7 years for males and 23.8 years for females (see figure 6.10). For all people contributing to NOM, the median age was higher at 27.1 years for males and 27.0 years for females.
Of the top 10 countries of birth for student visa holders in 2008-09, males and females born in Malaysia recorded the youngest median ages (21.5 years each). The highest median ages were recorded by Thailand-born student visa holders, for both males (26.3 years) and females (26.7 years).
6.10 NOM(a), Student visas(b), Country of birth(c), Median age, Australia
- 2008-09
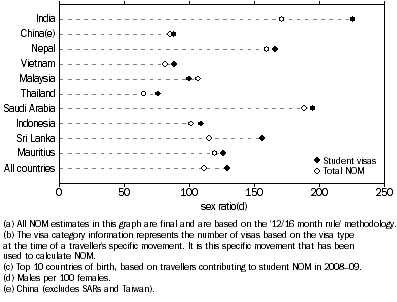
Sex ratios by country of birth
More males than females travelled on student visas in 2008-09 (see figure 6.11). The sex ratio (the number of males per 100 females) was 129 males for every 100 females. The sex ratio for total NOM during 2008-09 also indicated more males than females travelling, at 111 males per 100 females.
Of the top 10 countries (based on the net contribution to student NOM in 2008-09), students born in India had the highest sex ratio at 226 males per 100 females, followed by students born in Saudi Arabia (195 males per 100 females). The lowest sex ratios were recorded by Thailand-born (76 males per 100 females) and China-born and Vietnam-born (88 males per 100 females each).
When the sex ratios of student visa holders were compared with those for total NOM, all countries with the exception of Malaysia recorded more males than females. Malaysia-born had a student sex ratio of just under 100 males per 100 females (99.7 males) and a total NOM sex ratio of 107 males per 100 females. Examples of country comparisons with a large differential include India-born with 226 males per 100 females for student visa holders compared with 171 males per 100 females for total NOM; and Sri Lanka-born with a sex ratio of 156 males per 100 females for student visa holders compared with 115 males per 100 females for total NOM.
6.11 NOM(a), Student visas(b), Country of birth(c), Sex ratio(d), Australia
- 2008-09
State and Territory by country of birth
Victoria and New South Wales were, in most instances, the main destinations for students making a net contribution to student NOM in 2008-09 (see table 6.12). For India-born student visa holders 46% studied in Victoria, 20% studied in New South Wales and 19% studied in Queensland. For China-born student visa holders 39% studied in New South Wales and 33% in Victoria. Student visa holders from some countries in the top 10 used the courses offered by the states and territories on a more selective basis (e.g. 70% of Sri Lanka-born selected Victoria, while 68% of Thailand-born selected New South Wales). For other countries of birth, e.g. Malaysia and Saudi Arabia, the students were more evenly distributed across the states and territories.
6.12 NOM(a), Student visas(b) - States and territories and Country of birth, Proportion for each country of birth, Australia(c) - 2008-09 |
|
| NSW | Vic. | Qld | SA | WA | Tas. | NT | ACT | Aust.(d) |
| Country of birth(c) | % | % | % | % | % | % | % | % | no. |
|
| India | 20.1 | 45.7 | 18.8 | 7.3 | 7.2 | 0.2 | 0.1 | 0.5 | 42 955 |
| China(e) | 38.8 | 32.6 | 11.9 | 7.9 | 5.1 | 1.2 | 0.1 | 2.3 | 24 650 |
| Nepal | 57.4 | 25.0 | 9.9 | 3.3 | 3.5 | 0.2 | 0.4 | 0.4 | 10 514 |
| Vietnam | 31.1 | 45.7 | 8.3 | 5.3 | 7.0 | 0.3 | 0.5 | 1.8 | 6 036 |
| Malaysia | 14.1 | 40.4 | 12.6 | 12.8 | 14.9 | 2.6 | 0.3 | 2.3 | 3 479 |
| Thailand | 67.5 | 15.1 | 9.7 | 1.6 | 4.8 | 1.0 | - | 0.3 | 3 178 |
| Saudi Arabia | 32.6 | 24.6 | 18.5 | 7.5 | 10.3 | 2.9 | 0.1 | 3.5 | 3 170 |
| Indonesia | 62.2 | 20.8 | 5.4 | -2.6 | 12.1 | 0.2 | 0.4 | 1.5 | 2 533 |
| Sri Lanka | 9.7 | 70.3 | 8.6 | 3.8 | 6.6 | 0.1 | 0.1 | 0.8 | 2 475 |
| Mauritius | 16.8 | 45.4 | 2.7 | 0.6 | 33.9 | 0.3 | - | 0.3 | 2 229 |
| Other countries | 40.0 | 21.7 | 19.1 | 4.7 | 12.3 | 0.4 | 0.4 | 1.4 | 21 144 |
| All countries | 33.0 | 35.6 | 15.0 | 6.2 | 8.2 | 0.6 | 0.2 | 1.3 | 122 363 |
|
| - nil or rounded to zero (including null cells) |
| (a) All NOM estimates in this table are final and based on the '12/16 month rule' methodology. |
| (b) The visa category information represents the number of visas based on the visa type at the time of a traveller's specific movement. It is this specific movement that has been used to calculate NOM. |
| (c) Top 10 countries of birth, based on travellers contributing to student NOM in 2008-09. |
| (d) Includes Other Territories. |
| (e) China (excludes SARs and Taiwan). |
For travellers making a net contribution to student NOM in 2008-09, the state of Victoria was the highest recipient (43,600 persons). Table 6.13 shows that India-born student visa holders contributed 45% of all student travellers to that state, followed by China-born student visa holders (18%). New South Wales was the next highest recipient of students (40,400 persons). China-born student visa holders recorded 24% of students to that state, followed by India-born student visa holders (21%). While Tasmania only received a small number of students (740), and people born in China and India were the main contributors (a combined 53% of students), people born in Malaysia and Saudi Arabia also made substantial contributions with each country contributing 12% of students to the state of Tasmania.
6.13 NOM(a), Student visas(b) - States and territories and Country of birth, Proportion for each state and territory, Australia(c) - 2008-09 |
|
| Country of birth(c) | NSW | Vic. | Qld | SA | WA | Tas. | NT | ACT | Aust.(d) |
|
| Selected countries(%) | | | | | | | | | |
| India | 21.3 | 45.0 | 44.1 | 41.9 | 31.0 | 14.3 | 18.8 | 15.1 | 35.1 |
| China(e) | 23.7 | 18.5 | 16.0 | 25.8 | 12.7 | 38.4 | 12.2 | 37.8 | 20.1 |
| Nepal | 14.9 | 6.0 | 5.7 | 4.6 | 3.7 | 2.7 | 15.1 | 2.8 | 8.6 |
| Vietnam | 4.6 | 6.3 | 2.7 | 4.3 | 4.2 | 2.7 | 10.3 | 7.0 | 4.9 |
| Malaysia | 1.2 | 3.2 | 2.4 | 5.9 | 5.2 | 12.3 | 3.7 | 5.2 | 2.8 |
| Thailand | 5.3 | 1.1 | 1.7 | 0.7 | 1.5 | 4.2 | 0.4 | 0.6 | 2.6 |
| Saudi Arabia | 2.6 | 1.8 | 3.2 | 3.2 | 3.3 | 12.3 | 1.1 | 7.3 | 2.6 |
| Indonesia | 3.9 | 1.2 | 0.7 | -0.9 | 3.1 | 0.5 | 4.1 | 2.5 | 2.1 |
| Sri Lanka | 0.6 | 4.0 | 1.2 | 1.2 | 1.6 | 0.3 | 0.7 | 1.4 | 2.0 |
| Mauritius | 0.9 | 2.3 | 0.3 | 0.2 | 7.6 | 0.8 | 0.4 | 0.5 | 1.8 |
| Other countries | 20.9 | 10.5 | 22.0 | 13.2 | 26.0 | 11.5 | 33.2 | 19.8 | 17.3 |
| All countries(no.) | 40 419 | 43 582 | 18 304 | 7 542 | 9 973 | 740 | 271 | 1 530 | 122 363 |
|
| (a) All NOM estimates in this table are final and based on the '12/16 month rule' methodology. |
| (b) The visa category information represents the number of visas based on the visa type at the time of a traveller's specific movement. It is this specific movement that has been used to calculate NOM. |
| (c) Top 10 countries of birth, based on travellers contributing to student NOM in 2008-09. |
| (d) Includes Other Territories. |
| (e) China (excludes SARs and Taiwan). |
Student visa subclass by country of birth
Travellers making a net contribution to student NOM from the top 10 countries of birth in 2008-09 used specific education sector visa subclasses (see table 6.14). Students born in the majority of the top 10 countries used the VET or higher education visa subclasses the most. India-born students, the largest group of all student NOM, were highly represented in these two subclasses: VET (55%) and higher education (44%). China-born students, the second highest contributor to student NOM, mainly used the higher education subclass (64%). These two visa subclasses were not always the main two subclasses chosen by students from specific countries. For example, for Thailand-born students, 77% used the English language intensive courses for overseas students (ELICOS) subclass while 14% of Malaysia-born students used the postgraduate research subclass as their second highest course selection.
6.14 NOM(a), Student visa subclass(b) - Country of birth, Proportion for each country of birth, Australia(c) - 2008-09 |
|
| STUDENT VISA SUBCLASS(b) |
| 570- ELICOS(d) | 571- Schools | 572- VET(e) | 573- Higher education | 574- Post- graduate research | 575- Non- award | 576- AusAID/ Defence | Other student visas | Total student visas |
| Country of birth(c) | % | % | % | % | % | % | % | % | no. |
|
| India | 0.1 | 0.2 | 55.4 | 43.7 | 0.3 | 0.3 | 0.1 | - | 42 955 |
| China(f) | 2.0 | 14.5 | 15.6 | 64.2 | 1.5 | 1.7 | - | 0.6 | 24 650 |
| Nepal | 0.1 | 0.1 | 85.5 | 14.0 | 0.3 | - | 0.1 | - | 10 514 |
| Vietnam | 3.4 | 14.3 | 4.4 | 72.9 | 2.0 | - | 0.3 | 2.7 | 6 036 |
| Malaysia | 0.7 | 4.8 | 8.2 | 66.3 | 13.7 | 6.0 | 0.1 | 0.1 | 3 479 |
| Thailand | 77.1 | 1.0 | 22.1 | -1.5 | 0.5 | 0.7 | -0.1 | 0.1 | 3 178 |
| Saudi Arabia | 22.1 | 0.1 | 3.4 | 69.4 | 3.0 | 2.0 | - | 0.1 | 3 170 |
| Indonesia | 2.6 | 2.1 | 58.9 | 34.4 | 12.5 | 6.4 | -17.4 | 0.4 | 2 533 |
| Sri Lanka | 0.2 | 0.4 | 18.6 | 74.9 | 4.1 | 0.8 | 0.8 | 0.3 | 2 475 |
| Mauritius | 1.1 | - | 58.5 | 39.9 | - | 0.4 | - | - | 2 229 |
| Other countries | 33.8 | 1.2 | 32.0 | 25.8 | 5.1 | 1.8 | 0.6 | -0.2 | 21 144 |
| All countries | 9.1 | 4.1 | 39.2 | 44.1 | 2.2 | 1.2 | -0.2 | 0.2 | 122 363 |
|
| - nil or rounded to zero (including null cells) |
| (a) All NOM estimates in this table are final and based on the '12/16 month rule' methodology. |
| (b) The visa category information represents the number of visas based on the visa type at the time of a traveller's specific movement. It is this specific movement that has been used to calculate NOM. |
| (c) Top 10 countries of birth, based on travellers contributing to student NOM in 2008-09. |
| (d) English Language Intensive Courses for Overseas Students. |
| (e) Vocational Education and Training. |
| (f) China (excludes SARs and Taiwan). |
In 2008-09, the net contribution to student NOM from students holding higher education subclass visas was 44% (see table 6.14). Table 6.15 shows that students born in India made the main net contribution of 35% to the higher education visa subclass. India-born students were also the main net contributor to the second largest student subclass of VET, causing 50% of the VET visas contribution to NOM for the year. While the schools subclass representation was low (4% of all student visa holders contributing to NOM), 71% of the contribution to NOM from this visa subclass was from students born in China. It should also be noted that 64% of the contribution to NOM from ELICOS students was from students with countries of birth outside the top 10 countries. Countries outside the top 10 countries of birth included Brazil (16% of the net contribution to ELICOS students), Colombia (14%), South Korea (9%) and Turkey (4%).
6.15 NOM(a), Student visa subclass(b) - Country of birth, Proportion for each student visa subclass, Australia(c) - 2008-09 |
|
| | Student visa subclass(b) |
| Country of birth(c) | 570- ELICOS(d) | 571- Schools | 572- VET(e) | 573- Higher education | 574- Post- graduate research | 575- Non- award | 576- AusAID/ Defence | Other student visas | Total student visas |
|
| Selected countries(%) | | | | | | | | | |
| India | 0.2 | 1.9 | 49.6 | 34.7 | 4.6 | 9.4 | -9.4 | 2.3 | 35.1 |
| China(f) | 4.4 | 70.7 | 8.0 | 29.3 | 13.4 | 29.0 | -3.8 | 52.2 | 20.1 |
| Nepal | 0.1 | 0.3 | 18.7 | 2.7 | 1.0 | 0.1 | -3.8 | - | 8.6 |
| Vietnam | 1.8 | 17.1 | 0.5 | 8.2 | 4.4 | 0.2 | -8.9 | 54.2 | 4.9 |
| Malaysia | 0.2 | 3.3 | 0.6 | 4.3 | 17.5 | 14.8 | -2.1 | 0.7 | 2.8 |
| Thailand | 22.0 | 0.7 | 1.5 | -0.1 | 0.6 | 1.6 | 0.9 | 1.3 | 2.6 |
| Saudi Arabia | 6.3 | - | 0.2 | 4.1 | 3.5 | 4.5 | -0.4 | 0.7 | 2.6 |
| Indonesia | 0.6 | 1.1 | 3.1 | 1.6 | 11.7 | 11.5 | 187.2 | 3.7 | 2.1 |
| Sri Lanka | - | 0.2 | 1.0 | 3.4 | 3.7 | 1.4 | -8.1 | 2.3 | 2.0 |
| Mauritius | 0.2 | - | 2.7 | 1.6 | - | 0.6 | - | - | 1.8 |
| Other countries | 64.1 | 4.9 | 14.1 | 10.1 | 39.6 | 26.8 | -51.5 | -17.4 | 17.3 |
| All countries(no.) | 11 147 | 5 046 | 48 013 | 53 961 | 2 715 | 1 417 | -235 | 299 | 122 363 |
|
| - nil or rounded to zero (including null cells) |
| (a) All NOM estimates in this table are final and based on the '12/16 month rule' methodology. |
| (b) The visa category information represents the number of visas based on the visa type at the time of a traveller's specific movement. It is this specific movement that has been used to calculate NOM. |
| (c) Top 10 countries of birth, based on student visa holders contributing to NOM in 2008-09. |
| (d) English Language Intensive Courses for Overseas Students. |
| (e) Vocational Education and Training. |
| (f) China (excludes SARs and Taiwan). |
Student visa subclass by State and Territory
In 2008-09, the student visa subclass containing the highest contribution of any visa subclass contributing to NOM was the higher education subclass (54,000 students). Of all the states and territories where students resided, Victoria had the highest representation (35%) in this subclass (see table 6.16). Victoria also had the highest proportionate representation for many of the other visa subclasses. For the ELICOS subclass, the highest proportion of students making a net contribution to student NOM resided in New South Wales (49%), with Victoria having a lower proportion (17%). Western Australia maintained a relatively even proportion from each student visa subclass.
6.16 NOM(a), Student visa subclass(b) - States and territories, Proportion for each student visa subclass, Australia - 2008-09 |
|
| NSW | Vic. | Qld | SA | WA | Tas. | NT | ACT | Aust.(c) |
| Student visa subclass(b) | % | % | % | % | % | % | % | % | no. |
|
| 570-ELICOS(d) | 49.4 | 17.1 | 20.5 | 2.6 | 9.0 | 0.3 | 0.2 | 0.9 | 11 147 |
| 571-Schools | 33.2 | 35.0 | 11.0 | 9.4 | 8.0 | 1.1 | 0.2 | 2.0 | 5 046 |
| 572-VET(e) | 32.2 | 39.7 | 14.6 | 5.3 | 7.2 | 0.3 | 0.1 | 0.6 | 48 013 |
| 573-Higher education | 30.7 | 35.5 | 14.2 | 7.7 | 8.9 | 0.9 | 0.3 | 1.9 | 53 961 |
| 574-Postgraduate research | 27.7 | 32.6 | 19.4 | 7.7 | 8.7 | 0.6 | 0.1 | 3.1 | 2 715 |
| 575-Non-award | 22.7 | 56.6 | 11.9 | 0.1 | 8.0 | 0.3 | -0.1 | 0.4 | 1 417 |
| 576-AusAID/Defence | -13.6 | 40.0 | -35.7 | 72.8 | 4.7 | 0.4 | -2.1 | 33.6 | -235 |
| Other student visas | 43.1 | 40.1 | 4.0 | 8.4 | 1.3 | 1.0 | 0.3 | 1.7 | 299 |
| Total student visas | 33.0 | 35.6 | 15.0 | 6.2 | 8.2 | 0.6 | 0.2 | 1.3 | 122 363 |
|
| (a) All NOM estimates in this table are final and based on the '12/16 month rule' methodology. |
| (b) The visa category information represents the number of visas based on the visa type at the time of a traveller's specific movement. It is this specific movement that has been used to calculate NOM. |
| (c) Includes Other Territories. |
| (d) English Language Intensive Courses for Overseas Students. |
| (e) Vocational Education and Training. |
The contribution to NOM for each state and territory was largest from students using the higher education subclass of visa, ranging from 41% in New South Wales to 66% in the Australian Capital Territory, in 2008-09 (see table 6.17). Students using the VET visa subclass had the second highest contribution to NOM for each state and territory. Outside these two main visa subclasses the ELICOS visa subclass was well represented in New South Wales (14%), Queensland (12%) and Western Australia (10%), while the schools subclass was proportionally most evident in Tasmania (8%), the Australian Capital Territory (7%), and South Australia (6%) in 2008-09.
6.17 NOM(a), Student visa subclass(b) - States and territories, Proportion for each state and territory, Australia - 2008-09 |
|
| | NSW | Vic. | Qld | SA | WA | Tas. | NT | ACT | Aust.(c) |
|
| Student visa subclass(b)(%) | | | | | | | | | |
| 570-ELICOS(d) | 13.6 | 4.4 | 12.5 | 3.9 | 10.1 | 5.1 | 8.1 | 6.5 | 9.1 |
| 571-Schools | 4.1 | 4.1 | 3.0 | 6.3 | 4.0 | 7.8 | 4.1 | 6.7 | 4.1 |
| 572-VET(e) | 38.2 | 43.7 | 38.3 | 33.7 | 34.6 | 19.5 | 26.2 | 19.9 | 39.2 |
| 573-Higher education | 40.9 | 43.9 | 41.9 | 55.3 | 47.9 | 64.6 | 58.7 | 65.8 | 44.1 |
| 574-Postgraduate research | 1.9 | 2.0 | 2.9 | 2.8 | 2.4 | 2.2 | 1.1 | 5.6 | 2.2 |
| 575-Non-award | 0.8 | 1.8 | 0.9 | - | 1.1 | 0.5 | -0.4 | 0.4 | 1.2 |
| 576-AusAID/Defence | 0.1 | -0.2 | 0.5 | -2.3 | -0.1 | -0.1 | 1.8 | -5.2 | -0.2 |
| Other student visas | 0.3 | 0.3 | 0.1 | 0.3 | - | 0.4 | 0.4 | 0.3 | 0.2 |
| Total student visas(no.) | 40 419 | 43 582 | 18 304 | 7 542 | 9 973 | 740 | 271 | 1 530 | 122 363 |
|
| - nil or rounded to zero (including null cells) |
| (a) All NOM estimates in this table are final and based on the '12/16 month rule' methodology. |
| (b) The visa category information represents the number of visas based on the visa type at the time of a traveller's specific movement. It is this specific movement that has been used to calculate NOM. |
| (c) Includes Other Territories. |
| (d) English Language Intensive Courses for Overseas Students. |
| (e) Vocational Education and Training. |
1 APH 2010, Overseas students: immigration policy changes 1997–May 2010, p various.
<back
2 APH 2010, Overseas students: immigration policy changes 1997–May 2010, p 13.
<back
 Quality Declaration
  Print Page
 Print All