- Contents
- In this issue
- Section 1,Statistical summary
- Section 2,Population
- Section 3,Employment and earnings
- Section 4,State accounts
- Section 5,Prices
- Section 6,Consumption
- Section 7,International merchandise trade
- Section 8,Investment and finance
- Section 9,Construction
- Section 10,Mining and energy
- Section 11,Tourism
- Section 12,Social Trends - Families
- List of Historical Feature Articles
- About this Release
|
 SECTION 6 CONSUMPTION SECTION 6 CONSUMPTION
Retail
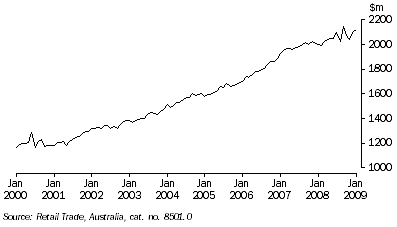
- As it is not possible to determine the trend in retail turnover through the period affected by the Government's stimulus package and other influences associated with global economic conditions, the retail trade trend series was suspended in November 2008.
- In seasonally adjusted terms, retail turnover in Western Australia rose by 1.4% in January 2009 following a larger increase (2.8%) in December 2008.
- In the preceding year, there were small fluctuations in the seasonally adjusted figures. Some of these may be related to the global financial situation in the second half of 2008 before the Australian government's economic stimulus package took effect in December.
- Apart from these recent monthly fluctuations, there has been steady growth in Western Australia's retail turnover since late 2000.
MONTHLY RETAIL TURNOVER, Current Prices - Seasonally Adjusted

- While the seasonally adjusted increase in turnover in December 2008 was spread across all areas of retail trade, increases in the following month occurred primarily in food retailing (up 5.0% or $40 million) and department stores (up 2.4% or $4 million).
- In contrast, the January turnover for household goods retailing fell by 3.9%, or $15 million, and for clothing and soft goods retailing by 2.7%, or $4 million.
16 RETAIL TRADE(a), monthly turnover - Current price: Seasonally Adjusted |
|
 |  | Food
retailing | Department
stores | Clothing and
soft good
retailing | Household
good
retailing | Other
retailing | Cafes, restaurants and
takeaway food
services | Total |
Seasonally adjusted ($m) |
|
| 2008 |  |  |  |  |  |  |  |
 | January | 755.8 | 171.6 | 139.3 | 366.6 | 300.3 | 262.4 | 1 996.0 |
 | February | 751.9 | 171.1 | 144.2 | 360.3 | 305.6 | 261.3 | 1 994.3 |
 | March | 765.0 | 168.0 | 138.8 | 367.9 | 315.2 | 267.8 | 2 022.8 |
 | April | 757.2 | 174.4 | 146.7 | 352.7 | 326.7 | 281.3 | 2 038.9 |
 | May | 769.2 | 172.1 | 144.9 | 353.3 | 330.1 | 279.4 | 2 049.1 |
 | June | 770.7 | 168.8 | 142.5 | 355.1 | 327.9 | 286.1 | 2 051.1 |
 | July | 806.6 | 181.5 | 117.5 | 343.1 | 326.4 | 321.6 | 2 096.8 |
 | August | 787.8 | 173.8 | 109.5 | 367.4 | 301.8 | 279.8 | 2 020.1 |
 | September | 842.0 | 178.6 | 113.4 | 373.7 | 349.5 | 293.0 | 2 150.2 |
 | October | 784.7 | 174.5 | 161.7 | 315.2 | 333.4 | 307.4 | 2 076.9 |
 | November | 812.0 | 166.6 | 120.6 | 341.5 | 315.2 | 284.1 | 2 040.0 |
 | December | 805.7 | 181.3 | 128.3 | 381.2 | 333.4 | 266.9 | 2 096.7 |
| 2009 |  |  |  |  |  |  |  |
 | January | 845.9 | 185.6 | 124.8 | 366.2 | 336.4 | 266.9 | 2 125.6 |
|
| (a) For industry definitions see paragraph 6 of the Explanatory Notes in the source publications. |
| Source: Retail Trade, Australia, cat. no. 8501.0. |
| Note: As of July 2008, all historical data have been revised as a result of changes to the survey design. |
New motor vehicle sales
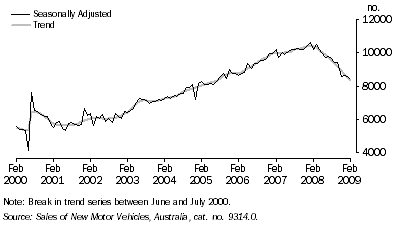
- There was a steady decrease in the sales of new motor vehicles (trend) in Western Australia over the thirteen months to February 2009. In that period, the number of vehicles sold fell by more than 19% to 8,370.
- Monthly vehicle sales in Western Australia have not surpassed 10,000 since May 2008 (10,033 vehicles).
NEW MOTOR VEHICLE SALES

- In the three months to February 2009, new motor vehicle sales were almost 7% lower than in the previous three month period.
- In the three months to February 2009, a decline in sales was recorded for all vehicle types including passenger vehicles (5%), sports utility vehicles (7%) and other vehicles (10%).
17 New Motor Vehicle Sales, By type of vehicle: Trend |
|
 |  | Passenger vehicles | Sports utility vehicles | Other vehicles | Total vehicles |
| Month | no. | no. | no. | no. |
Trend |
|
| 2007 |  |  |  |  |
 | December | 5 636 | 2 194 | 2 553 | 10 382 |
| 2008 |  |  |  |  |
 | January | 5 587 | 2 229 | 2 592 | 10 408 |
 | February | 5 535 | 2 250 | 2 601 | 10 386 |
 | March | 5 490 | 2 237 | 2 579 | 10 306 |
 | April | 5 454 | 2 190 | 2 534 | 10 177 |
 | May | 5 419 | 2 129 | 2 484 | 10 033 |
 | June | 5 372 | 2 069 | 2 450 | 9 892 |
 | July | 5 284 | 2 020 | 2 443 | 9 747 |
 | August | 5 147 | 1 977 | 2 457 | 9 581 |
 | September | 4 987 | 1 933 | 2 462 | 9 383 |
 | October | 4 839 | 1 885 | 2 438 | 9 162 |
 | November | 4 724 | 1 829 | 2 373 | 8 926 |
 | December | 4 645 | 1 778 | 2 282 | 8 705 |
| 2009 |  |  |  |  |
 | January | 4 593 | 1 739 | 2 184 | 8 516 |
 | February | 4 566 | 1 712 | 2 093 | 8 370 |
|
| Source: Sales of New Motor Vehicles, Australia, cat. no. 9314.0. |
|
 Print Page
 Print All