- Contents
- In this issue
- Section 1,Statistical summary
- Section 2,Population
- Section 3,Employment and earnings
- Section 4,State accounts
- Section 5,Prices
- Section 6,Consumption
- Section 7,International merchandise trade
- Section 8,Investment and finance
- Section 9,Construction
- Section 10,Mining and energy
- Section 11,Tourism
- Section 12,Social Trends - Families
- List of Historical Feature Articles
- About this Release
|
 SECTION 5 PRICES SECTION 5 PRICES
Consumer Price Index
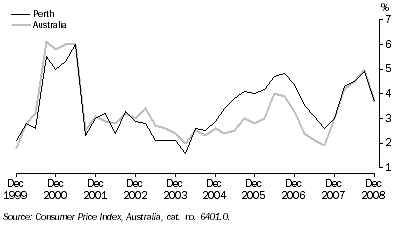
- Despite an overall rise in Perth's prices during 2008, the three months to December 2008 saw Perth's CPI fall 0.3%, the first decrease since March 1999. The main drivers of this decrease were transportation costs, which fell by 6.5% in the December quarter. This reflected the lower price of automotive fuel (down 17%) and motor vehicles (down 2.4%).
- In the year to December 2008, Perth's Consumer Price Index (CPI) rose 3.7%, on par with the nation's CPI rise. Of the Australian capital cities, Brisbane had the largest increase (4.3%) while Melbourne had the smallest (3.2%).
CONSUMER PRICE INDEX (ALL GROUPS), Change from same quarter previous year

- The main contributors to Perth's CPI growth in 2008 were Education (up 7.8%) and Financial and insurance services (up 7.7%).
- The increase in prices across all Education sectors (primary, secondary and tertiary) occurred primarily between December and March. This has been a consistent pattern over many years, most likely reflecting increases in education costs levied at the commencement of each academic year.
- Rising prices in Financial and insurance services reflected increases in the price of deposit and loan facilities as well as insurance.
12 CONSUMER PRICE INDEX(a), By group - Perth |
|
 | CHANGE FROM PREVIOUS FINANCIAL YEAR | CHANGE FROM SAME QUARTER PREVIOUS YEAR | CHANGE FROM PREVIOUS QUARTER |
 | 2006-2007 | 2007-2008 | December 2008 | September 2008 | December 2008 |
 | % | % | % | % | % |
|
| All groups | 4.0 | 3.6 | 3.7 | 1.0 | -0.3 |
| Food | 5.4 | 4.2 | 5.5 | 0.4 | 1.2 |
| Alcohol and tobacco | 3.6 | 4.1 | 6.3 | 2.2 | 1.3 |
| Clothing and footwear | -0.9 | -0.9 | -1.4 | -2.3 | 1.1 |
| Housing | 7.4 | 4.6 | 5.9 | 2.7 | 0.8 |
| Household contents and services | 2.3 | -0.7 | 1.5 | 0.2 | 1.1 |
| Health | 5.3 | 5.4 | 5.0 | -0.2 | -0.6 |
| Transportation | 2.4 | 4.7 | -1.0 | 0.3 | -6.5 |
| Communication | 1.3 | 0.3 | 0.6 | 0.2 | 0.4 |
| Recreation | 1.9 | 2.0 | 0.8 | 0.4 | 0.9 |
| Education | 6.9 | 7.8 | 7.8 | - | - |
| Financial and insurance services(b) | 2.0 | 5.7 | 7.7 | 0.9 | -0.6 |
|
| - nil or rounded to zero (including null cells) |
| (a) Unless otherwise specified, base of each index: 1989-90 = 100.0. |
| (b) Base of index: June quarter 2005 = 100.0. |
| Source: Consumer Price Index, Australia, cat. no. 6401.0. |
Wage Price Index
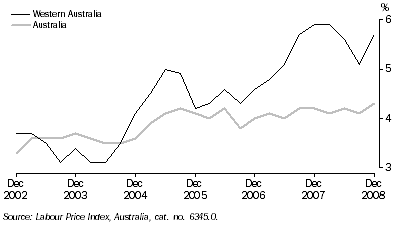
- Western Australia's Wage Price Index (WPI) rose 1.8% in the December quarter 2008. This followed growth of 1.3% and 1.4% in the two previous quarters.
- The State's 'all sector' WPI growth of 1.8% was higher than Australia's growth of 1.2% and was the highest among all states and territories.
- Through the year to December 2008, the WPI for Western Australia grew 5.7%, which was considerably higher than the national growth of 4.3%.
WAGE PRICE INDEX, Change from same quarter previous year

- In the December quarter 2008 public sector wages increased by 3.1%, more than double the private sector increase (1.4%). This reflects some pay increases for Western Australian Government employees implemented during the quarter, including backdated pay rises for the general public service and teachers.
- Of the selected industries, wage increases in the December quarter were highest in Government administration and defence (4.3%) followed by Education (3.1%), Manufacturing (1.9%) and Health and Community Services (1.7%).
- Mining had the strongest wage price growth for the year (7.3%) but the lowest for the quarter (0.6%). Similarly, growth was high in Construction for the year (7.0%) but relatively low for the quarter (1.3%). Retail trade had the lowest wage price index rise for the year (3.3%) and the second lowest for the quarter (0.9%).
13 WAGE PRICE INDEX, Total hourly rates of pay excluding bonuses: Original |
|
 |  | 2007 | 2008 | Change from |
 |  | December | September | December | Previous quarter | Same quarter previous year |
 |  | index | index | index | index | index |
|
| Western Australia | 120.0 | 124.5 | 126.8 | 1.8 | 5.7 |
| Sector |  |  |  |  |  |
 | Private | 120.7 | 125.6 | 127.4 | 1.4 | 5.6 |
 | Public | 117.7 | 121.0 | 124.8 | 3.1 | 6.0 |
| Selected Industries |  |  |  |  |  |
 | Mining | 124.8 | 133.1 | 133.9 | 0.6 | 7.3 |
 | Manufacturing | 121.1 | 125.3 | 127.7 | 1.9 | 5.5 |
 | Construction | 136.4 | 144.0 | 145.9 | 1.3 | 7.0 |
 | Retail trade | 117.5 | 120.3 | 121.4 | 0.9 | 3.3 |
 | Accommodation, cafes and restaurants | 115.2 | 118.7 | 120.4 | 1.4 | 4.5 |
 | Transport and storage | 117.0 | 122.8 | 124.5 | 1.4 | 6.4 |
 | Property and business services | 120.6 | 126.3 | 128.2 | 1.5 | 6.3 |
 | Government administration and defence | 118.0 | 119.8 | 124.9 | 4.3 | 5.8 |
 | Education | 117.0 | 120.4 | 124.1 | 3.1 | 6.1 |
 | Health and community services | 116.0 | 120.3 | 122.4 | 1.7 | 5.5 |
 | Personal and other services | 121.2 | 126.4 | 127.9 | 1.2 | 5.5 |
|
| Source: ABS data available on request, Labour Price Index, Australia, cat. no. 6345.0. |
| Note: No occupation data from September quarter 2008 onwards. |
House Price Indexes
- According to preliminary estimates for the December quarter 2008, the price index for established houses in Perth continued to decline for the fourth successive quarter. However, the fall (0.9%) was considerably lower than in the June and September quarters (2.3% and 2.5% respectively).
- In contrast, the price index for project homes increased 1.0% in the December 2008 quarter. This index has climbed by 3.8% since the December quarter 2007.
14 House Price Indexes(a) - Perth |
|
 |  | ESTABLISHED HOMES(b) | Change from previous period(b) | PROJECT HOMES | Change from previous period |
| Reference period | index | % | index | % |
|
| 2006-2007 | 192.8 | 32.3 | 144.1 | 10.6 |
| 2007-2008 | r194.8 | r1.1 | 148.7 | 3.2 |
| 2007 |  |  |  |  |
 | September | 195.5 | 1.8 | 147.6 | 0.9 |
 | December | 197.6 | 1.1 | 148.3 | 0.5 |
| 2008 |  |  |  |  |
 | March | 195.3 | -1.2 | 148.8 | 0.3 |
 | June | r190.8 | r-2.3 | 150.0 | 0.8 |
 | September | p186.1 | p-2.5 | 152.5 | 1.7 |
 | December | p184.4 | p-0.9 | 154.0 | 1.0 |
|
| p preliminary figure or series subject to revision |
| r revised |
| (a) Base of each index 2003-04 = 100.0. |
| (b) Estimates for the two most recent quarters are experimental (see paragraph 12 and 13 of the Explanatory Notes in the source publication). |
| Source: House Price Indexes, Eight Capital Cities, cat. no. 6416.0. |
Price indexes of materials used in building
- In the December quarter 2008, the increase in the price of materials for house building in Western Australia slowed to 1.1%. This was the lowest quarterly increase since December 2007.
- During the year ending December 2008 the price index for these materials rose by nearly 9%. This was around two percentage points higher than the national rise.
- The largest contributors to the increase over the year were steel and other metal products.
15 Price index of materials used in house building(a), By material - Perth |
|
 | 2007 | 2008 | Percentage change |
 | December | September | December | Sep Qtr 2008 to Dec Qtr 2008 | Dec Qtr 2007 to Dec Qtr 2008 |
| Material group | index | index | index | % | % |
|
| All groups | 149.0 | 160.5 | 162.3 | 1.1 | 8.9 |
| Timber, board and joinery | 134.7 | 145.1 | 143.7 | -1.0 | 6.7 |
| Ceramic products | 160.1 | 163.6 | 164.2 | 0.4 | 2.6 |
| Concrete, cement and sand | 156.8 | 168.5 | 171.8 | 2.0 | 9.6 |
| Cement products | 134.3 | 136.5 | 136.5 | - | 1.6 |
| Steel products | 184.8 | 244.8 | 249.4 | 1.9 | 35.0 |
| Other metal products | 146.6 | 154.8 | 162.5 | 5.0 | 10.8 |
| Plumbing products | 135.1 | 144.6 | 145.8 | 0.8 | 7.9 |
| Electrical equipment | 116.4 | 121.9 | 120.8 | -0.9 | 3.8 |
| Installed gas and electrical appliances | 140.3 | 145.1 | 145.2 | 0.1 | 3.5 |
| Other materials | 169.5 | 178.1 | 180.0 | 1.1 | 6.2 |
|
| - nil or rounded to zero (including null cells) |
| (a) Reference base of each index: 1989-90 = 100.0 |
| Source: Producer Price Indexes, Australia, cat. no. 6427.0. |
|
 Print Page
 Print All