SENTENCE OUTCOMES
The following information relates to sentence outcomes for defendants proven guilty in the Higher Courts. Sentence refers to the principal sentence a proven guilty defendant received (refer to Explanatory Notes paragraphs 45-48 for further information).
Differences in sentencing result from the offence with which the defendant was proven guilty, as well as a range of aggravating and mitigating factors taken into account by the court, such as prior convictions, level of violence, whether the offender was provoked, and demonstrations of remorse. The range of sentences available also differs across states and territories.
Custodial orders
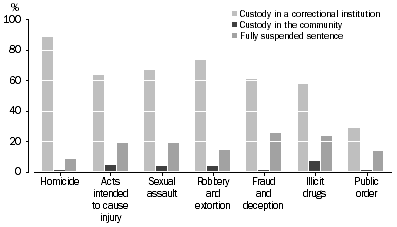
The majority (86% or 10,953) of defendants proven guilty in 2010-11 received a custodial order. This proportion has slightly increased from 2005-06 when it was 82% (Table 2.2). Of defendants proven guilty, 62% were sentenced to custody in a correctional institution; 4% to custody in the community; and 19% were granted fully suspended sentences (Table 2.1).
Defendants proven guilty of homicide offences were most likely to receive a sentence of custody in a correctional institution (88%), followed by robbery and extortion (73%) and sexual assault (67%) (Table 2.1).
DEFENDANTS PROVEN GUILTY, Selected principal offence by custodial sentence
A greater proportion of males received a sentence of custody in a correctional institution than females (64% compared with 48%). A larger proportion of females were given fully suspended sentences than males (24% and 19% respectively) (Table 2.9).
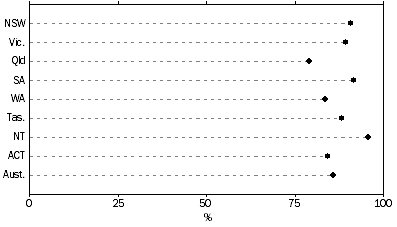
The proportion of defendants receiving a custodial order varied across states and territories, ranging from 79% in Queensland to 96% in the Northern Territory (Table 2.3).
DEFENDANTS PROVEN GUILTY, Custodial orders by states and territories
Non-custodial orders
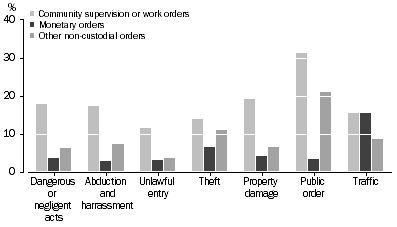
Of defendants proven guilty in the Higher Courts 14% (1,814) were sentenced to non-custodial orders (community supervision or work orders, monetary orders and other non-custodial orders), a slightly lower proportion than in 2009-10 (Table 2.2).
Community supervision or work orders was proportionally highest for defendants proven guilty of public order offences (31%) and property damage and environmental pollution (19%) (Table 2.7).
DEFENDANTS PROVEN GUILTY, Selected principal offence by non-custodial sentence
The proportion of females receiving community supervision or work orders (15%) is more than double the proportion of males (7%). A larger proportion of defendants under 20 years of age received a non-custodial order (25% of males and 43% of females), compared with other age groups (Table 2.9).
 Quality Declaration
  Print Page
 Print All