1367.0 - State and Territory Statistical Indicators, 2012
ARCHIVED ISSUE Released at 11:30 AM (CANBERRA TIME) 03/04/2012 Final
Page tools:
 Print Page Print Page
 Print All Print All
| ||
TOURIST ACCOMMODATION 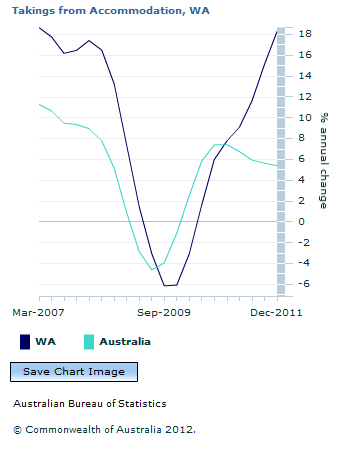 Footnote(s): Hotels, motels and serviced apartments with 15 or more rooms (trend) Source(s): Tourist Accommodation, Australia (cat. no. 8635.0) 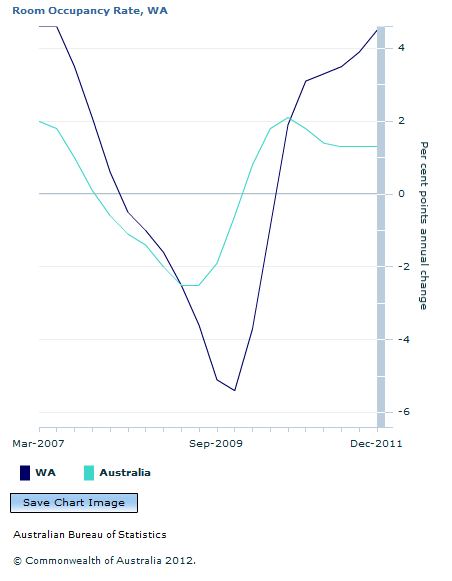 Footnote(s): Hotels, motels and serviced apartments with 15 or more rooms (trend) Source(s): Tourist Accommodation, Australia (cat. no. 8635.0) In WA in the December quarter 2011, in trend terms:
Useful Links
Overseas Arrivals and Departures, Australia (cat no. 3401.0) Australian National Accounts: Tourism Satellite Account (cat. no. 5249.0) Tourism @ a Glance Document Selection These documents will be presented in a new window.
|
||
