there were 222,600 operating businesses, or 1,600 more than June 2010
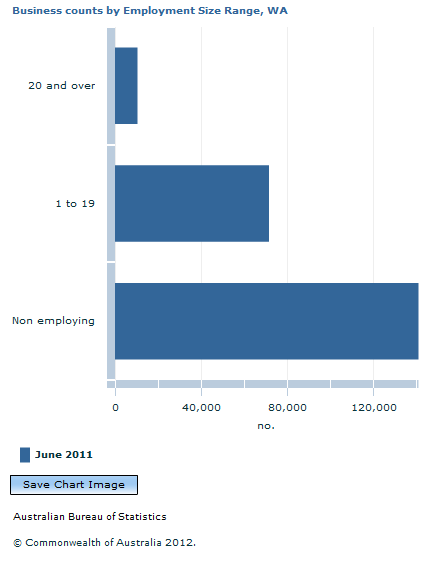
the majority of these were small businesses, with 63% of the total being non-employing businesses and 32% employing 1-19 employees
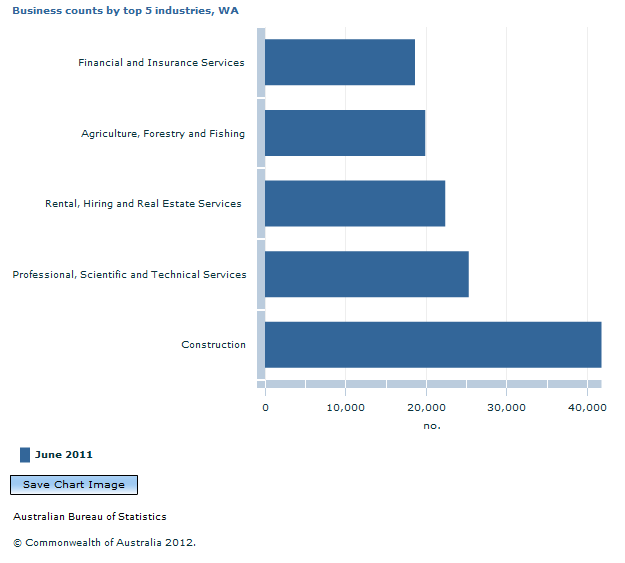
the industries with the highest number of businesses included: Construction (19% of all businesses), Professional, Scientific and Technical Services (11%), Rental, Hiring and Real Estate Services (10%), Agriculture, Forestry and Fishing (9%), and Financial and Insurance Services (8%).
Do you know how many businesses operate in your state or territory?
The ABS counts the number of businesses operating in the Australian economy, including rates of business entries and exits and business survival. These data are sourced from the ABS Business Register. They show the number of operating businesses at the end of June in each financial year and only include businesses which actively traded in goods or services during the reference period.
Where possible, businesses are also classified according to industry class (ANZSIC), main state of operation, type of legal organisation (TOLO), institutional sector (SISCA), size range by employment or turnover. Some complex or multi-locational businesses were not able to be classified to main state of operation or industry due to insufficient information being provided.
Component items in the graphs above may not sum to published totals due to rounding and confidentialisation of the data. Due to changes in scope, these counts are not directly comparable to previous releases. More detailed data are available from the ABS website.
Document Selection
These documents will be presented in a new window.
 Print Page
 Print All