INDUSTRY AND OCCUPATION
The industry and occupation information presented in this chapter uses revised classifications (ANZSIC06 and ANZSCO). Both classifications are new for the 2006 Census and are not directly comparable to those used in the 2001 Census. For 2001 and 2006 Census comparisons using previous classifications see Appendix 2: Census labour force data.
Industry
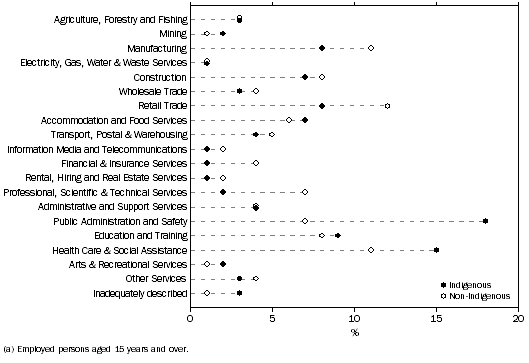
The most common industries in which Indigenous people were employed in 2006 were Public Administration and Safety (18%), Health Care and Social Assistance (15%), Education and Training (9%), Retail Trade (8%) and Manufacturing (8%). The most common industries in which non-Indigenous people were employed were Retail Trade (12%), Manufacturing (11%) and Health Care and Social Assistance (11%).
Indigenous females were most likely to be employed in Health Care and Social Assistance (22%), Public Administration and Safety (17%), Education and Training (14%) and Retail Trade (10%). Indigenous males were most likely to be employed in Public Administration and Safety (18%), Construction (12%), Manufacturing (12%) and Health Care and Social Assistance (9%).
INDUSTRY OF EMPLOYMENT(a)

In comparison with other industries, a relatively high proportion of employed Indigenous people were working in Manufacturing and Retail Trade in Major Cities (10% and 9% respectively) and Inner Regional areas (10% each), reflecting the geographical location of these particular industries. The largest industries of employment in Remote and Very Remote areas were Public Administration and Safety (20% and 44% respectively), Health Care and Social Assistance (19% and 20% respectively) and Education and Training (10% and 7% respectively). Together these three industries accounted for 49% of the employment in Remote areas and 72% of employment in Very Remote areas. In comparison, these industries accounted for 33% of Indigenous employment in Major Cities.
Nationally, Indigenous people were two and a half times more likely than non-Indigenous people to be employed in Public Administration and Safety (18% and 7% respectively). In Very Remote areas, CDEP schemes tend to be managed by community councils and therefore CDEP participants would commonly have their industry of work classified to the Public Administration and Safety or Health Care and Social Assistance categories.
In geographically remote areas, the Agriculture, Forestry and Fishing, and the Mining industries, combined, accounted for a much smaller share of Indigenous employment than non-Indigenous employment (11% compared with 30% respectively in Remote areas and 6% compared with 32% respectively in Very Remote areas).
Occupation
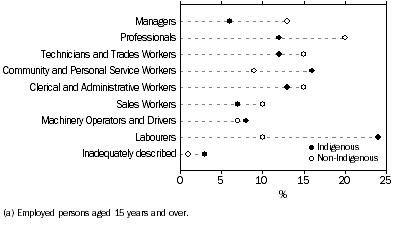
The most common occupation groups for employed Indigenous people were Labourers (24%), followed by Community and Personal Service workers (16%) and Clerical and Administrative workers (13%). In contrast, the most common occupation group for non-Indigenous people was Professionals (20%). A relatively high proportion of both Indigenous and non-Indigenous people were employed as Clerical and Administrative workers (13% and 15% respectively) and Technicians and Trades Workers (12% and 15% respectively).
OCCUPATION(a)

The proportion of employed Indigenous people working as Labourers rose with increasing geographic remoteness, from about one in seven (16%) in Major Cities to about two in five (44%) in Very Remote areas. In the Major Cities, Indigenous people were most likely to be employed as Labourers (16%) and Clerical and Administrative Workers (16%). In contrast, Indigenous people employed in Very Remote areas were most likely to be Labourers (44%) and Community and Personal Service Workers (17%).
 Print Page
 Print All