SEASONAL ADJUSTMENT METHODOLOGY
2.1 When analysing an original series, users may want to identify the cause of the movement recorded. An original time series can be decomposed into three components: the trend (the general direction of the series), the seasonal component (systematic, calendar related movements) and the irregular component (unsystematic, short term fluctuations). Seasonally adjusted series are produced by estimating the seasonal component and removing this from the original series. In most economic data the seasonal component is a combination of seasonal influences (e.g. the effect of the weather or social traditions) plus other kinds of calendar related variations such as Chinese New Year and Christmas. The seasonal adjustment methodology takes into account both seasonal and other calendar related factors that evolve over time to reflect changes in activity patterns.
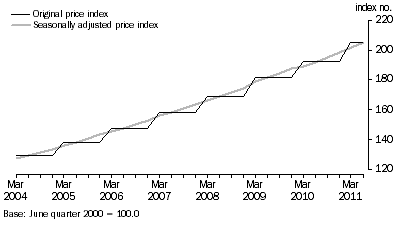
2.2 As an example, it can be seen from Graph 1 that the expenditure class ‘Secondary education’ typically rises each March quarter, with little movement recorded in the remaining quarters of the year. In the seasonally adjusted series the systematic rise recorded in the March quarter each year has been removed.
GRAPH 1: SECONDARY EDUCATION PRICE INDEX, Weighted average of eight capital cities

The seasonal adjustment methodology used in the 15th series to calculate the Trimmed mean and Weighted median underlying trend measures was developed by the RBA (this is referred to as the 15th series seasonal adjustment methodology). The methodology primarily looked for a consistent seasonal pattern over the entire span of a series and used a series of statistical tests to test for seasonality. Using this seasonal adjustment methodology, 20 out of the 90 expenditure classes in the 15th series of the CPI were identified as being seasonal.
2.4 In 2010, the ABS conducted a seasonal adjustment review that used a range of statistical tests to determine if stable and evolving seasonality was present in each expenditure class. This methodology, called the 16th series seasonal adjustment methodology, identified expenditure classes that show seasonal patterns over any part of the time series as being seasonal. The review identified an increased number of expenditure classes to be seasonal. The increase was due to the availability of additional time series data, changes in the seasonality of expenditure classes and a different conceptual basis for assessing seasonality. Using this seasonal adjustment methodology, 64 of the 90 expenditure classes in the 15th series of the CPI were identified as having a seasonal pattern.
2.5 A table which outlines the 15th series expenditure classes that were identified as seasonal under the 15th and 16th series seasonal adjustment methodologies is attached in Appendix 1.
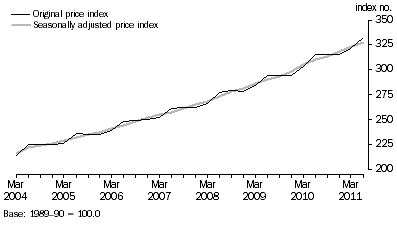
2.6 For example, from Appendix 1 it can be seen that the ‘Hospital and medical services’ expenditure class was identified as not being seasonal under the 15th series seasonal adjustment methodology. Following the 2010 review, the 16th series seasonal adjustment methodology identified the ‘Hospital and medical services’ expenditure class to contain emerging seasonality with March quarters seasonally low and June quarters seasonally high (as seen in Graph 2). The benefit of adjusting the series is seen in the following graph of the ‘Hospital and medical services’ original and seasonally adjusted price index, where the seasonally adjusted series has removed the calendar related influences from the original series.
GRAPH 2: HOSPITAL AND MEDICAL SERVICES PRICE INDEX, Weighted average of eight capital cities

The standard ABS seasonal adjustment methodology being introduced is concurrent seasonal adjustment. This method uses the original time series available at each reference period to estimate seasonal factors for the current and previous quarters. Concurrent seasonal adjustment uses all available data to derive the combined adjustment factors for the previous quarter and for the same quarter in the preceding year. Seasonal patterns are reanalysed when there are known changes to regular events. The ABS will conduct reanalysis of the model used to estimate seasonal factors annually.
REVISIONS
2.8 Through concurrent seasonal adjustment, the most recent data can be utilised to capture changes in spending patterns and other macro-economic impacts. Moving to the standard ABS seasonal adjustment methodology will result in a greater than usual number of revisions to the historical series when first published in the September quarter 2011 for the Weighted median and Trimmed mean. The potential increase in the number of revisions initially is due to the increase in the number of expenditure classes identified as seasonal when the standard ABS seasonal adjustment methodology is applied.
2.9 For more information regarding the seasonal adjustment methodology used in the ABS please see Information Paper: An Introductory Course on Time Series Analysis (cat. no. 1346.0.55.001).
BREAKS IN A TIME SERIES
2.10 Price indexes can be affected by an abrupt and sustained change in the level of the series. Breaks in individual series are not removed from the seasonally adjusted price indexes, but are accounted for in the Trimmed mean and Weighted median as described in Chapter 5.
2.11 For example, the introduction of the Goods and Services Tax (GST) in the September quarter 2000 caused a shock to a large number of price series at the same time. The break in series caused by the introduction of the GST has not been removed from the seasonally adjusted estimates but its effect has been taken into account during the seasonal adjustment process as per ABS standard practice. Analysis of the impact of the introduction of the GST on the CPI is available in the feature article ‘Measuring the impact of the new tax system on the September Quarter 2000 Consumer Price Index’ in the December 2000 issue of Australian Economic Indicators (cat. no. 1350.0).
2.12 More information regarding seasonal adjustment treatments can be found in the feature article ‘When it's not "Business-as-usual": Implications for ABS Time Series’ in the August 2009 issue of Australian Economic Indicators (cat. no. 1350.0).
TREND ESTIMATES OF THE CPI
2.13 A study conducted in 2004 into seasonal adjustment of the CPI concluded that trend estimates of the CPI were generally not markedly different from the original series. The results of the 2004 study ‘Seasonally Adjusted and Trend Estimates for the Consumer Price Index (CPI)’ can be found in the December 2004 issue of Australian Economic Indicators (cat. no. 1350.0).
2.14 Analysis undertaken in 2011 confirmed the conclusions of the 2004 study – that direct trend estimates of the All groups CPI, derived using standard trend calculations, was still not distinctly different from the original series. A direct trend series is derived by adjusting the All groups CPI, and not through the aggregation of trend estimates of its components. The ABS does not propose to produce direct trend estimates of the All groups CPI at this stage. As part of the analytical work program the ABS will re-conduct this analysis to review if trend estimates of the All groups CPI should be produced.
 Print Page
 Print All