INTRODUCTION
Where were you on Census Night, Tuesday the 9th of August, 2011?
Most people in Australia were counted at home on Census Night. This is not surprising, as the Census was held on a Tuesday in winter when people are less likely to be away on holidays. Despite this, 5.4% of people in Australia were staying somewhere else on that night. These people may have been travelling for work or study, on holiday, visiting friends or family, or travelling for many other reasons.
This article identifies patterns in the movement of people in Australia on Census Night in 2011 by analysing two population measures – the Census Night population and the usual resident population. The Census Night population is the number of people counted in an area on Census Night (also known as the “enumerated” population). The usual resident population is the number of people who record in the Census that they usually live in an area, regardless of where they are on Census Night. Census data also enables the characteristics of these populations to be analysed. This article provides population pyramids to present the age and gender of Census Night and usual resident populations. Further analysis of the two populations could compare other characteristics, such as income or employment.
Census data is available for Local Government Areas (LGAs), which represent the areas in which local governments, or local councils, are responsible for community needs like planning, public recreation facilities and services such as waste collection. The Census is not the official estimate of Australia's population. The official measure of Australia's population is the Estimated Resident Population, which is based on Census data, but adjusted for Census undercount (see "Census Fact Sheet: Population Measures" on the ABS website for more detail on this subject).
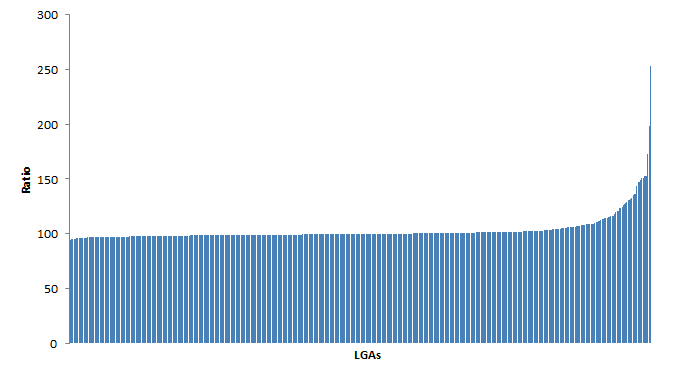
The Census Night and usual resident populations are compared using the "Census Night ratio", which is the number of people in the LGA on Census Night for every 100 usual residents. In 2011, most LGAs had a Census Night population similar to the usual resident population, meaning the Census Night ratio was close to 100. A Census Night ratio below 100 means the Census Night population was smaller than the usual resident population. Conversely, a Census Night ratio above 100 means the Census Night population was larger than the usual resident population.
The chart below shows the Census Night ratios from lowest to highest for all LGAs. A small group of LGAs had ratios over 110, while the lower ratios were close to 100. This suggests that people travelled from many places to a few main destinations. |
CENSUS NIGHT RATIOS(a), Local Government Areas - 2011
 (a) The Census Night ratio is the ratio of the Census Night population to usual resident population, multiplied by 100.
Source: ABS Census of Population and Housing, 2011.
Only the 463 LGAs with a usual resident population over 1,500 are included in the chart because in LGAs with smaller populations the movements of a few people can have a large effect. However, the Census Night ratio for every LGA in Australia is provided in the datacube on the downloads tab. The analysis in the rest of this article focusses on the 10% of LGAs with populations over 1,500 that had the highest Census Night ratios. Population data for each of these 46 LGAs can be found in the relevant state or territory chapter.
For further analysis of different population measures from the 2011 Census, see:
Western Australia – Outback: A Population Overview, 2012 (cat. no. 2071.0),
Counting Resident and Non-resident populations in the Census, 2012 (cat. no. 2071.0), and
Towns of the Mining Boom, 2013 (cat. no. 4102.0). The latest estimates of regional populations can be found in
Regional Population Growth, Australia, 2012 (cat. no. 3218.0) and
Population by Age and Sex, Regions of Australia, 2012 (cat. no. 3235.0).
 Print Page
 Print All