Click on the drop down dialogue box above under 'Select a different indicator' and choose from an expanded selection of 10 popular indicators.
All of the indicators are available within the publication State and Territory Statistical Indicators (cat. no. 1367.0) and are updated as new ABS data become available.
Highest
Lowest
Indicator
Time period(a)
State
Value
State
Value
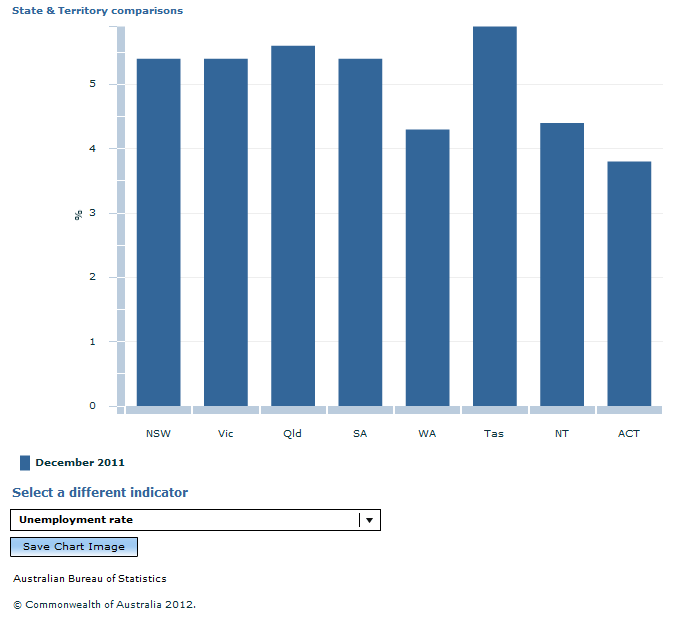
Unemployment rate
(Trend)
Dec 2011 (M)
Tas
5.9%
ACT
3.8%
Average weekly earnings
(Full-time adult ordinary time, original)
Aug 2011 (%Q/Q-4))
WA
10.4%
Vic
2.4%
Building approvals
(No. of dwelling units approved, trend)
 Print Page
 Print All