PROJECTED HOUSEHOLDS
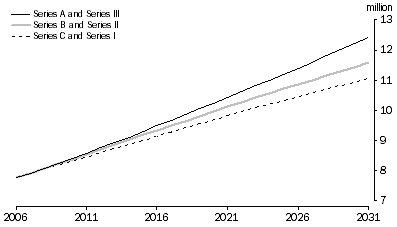
Using the Series B projection as the assumption about the future population of Australia results in a range of between 11.4 and 11.8 million households in Australia in 2031. This is an increase of between 3.7 and 4.0 million households. If the Series A projection were used as the future population, the projected number of households would be 5% higher, increasing by between 4.3 and 4.6 million households to reach between 12.0 and 12.4 million households in 2031. If the Series C projection were used, the number would be 3% lower, increasing by between 3.3 and 3.6 million households to reach between 11.1 and 11.4 million households.
5.2 Projected households, Australia, Selected combinations of projection series

Similar results are apparent for all household types, with higher numbers of family, group and lone person households being projected using the Series A population and fewer numbers being projected using the Series C population.
5.3 Projected households, Using different population projections |
|
 |  | Population projection series(a) |
 |  | Series A | Series B | Series C |
| Series and household type(b) | '000 | '000 | '000 |
ESTIMATED HOUSEHOLDS, 2006 |
|
| Households |  |  |  |
 | Family | 5 628.7 | 5 628.7 | 5 628.7 |
 | Group | 291.4 | 291.4 | 291.4 |
 | Lone person | 1 860.0 | 1 860.0 | 1 860.0 |
 | Total | 7 780.2 | 7 780.2 | 7 780.2 |
PROJECTED HOUSEHOLDS, 2031 |
|
| Series I |  |  |  |
 | Family | 8 424.8 | 8 024.4 | 7 728.6 |
 | Group | 410.2 | 387.5 | 367.4 |
 | Lone person | 3 207.7 | 3 029.6 | 2 956.8 |
 | Total | 12 042.7 | 11 441.6 | 11 052.8 |
| Series II |  |  |  |
 | Family | 8 377.9 | 7 978.5 | 7 688.7 |
 | Group | 400.6 | 378.7 | 359.2 |
 | Lone person | 3 409.1 | 3 219.3 | 3 136.4 |
 | Total | 12 187.6 | 11 576.5 | 11 184.3 |
| Series III |  |  |  |
 | Family | 8 278.8 | 7 880.5 | 7 600.8 |
 | Group | 370.7 | 350.8 | 333.0 |
 | Lone person | 3 766.0 | 3 557.7 | 3 455.2 |
 | Total | 12 415.4 | 11 789.0 | 11 389.1 |
|
| (a) Series A, B and C refer to population projections from Population Projections, Australia, 2006 to 2101 (cat. no. 3222.0). |
| (b) Series I, II and III refer to assumptions made about future living arrangements of the population of Australia. See Chapter 2 - Assumptions for more detail. |
 Quality Declaration
  Print Page
 Print All