|
|
MEASURES OF SPREAD
A box and whisker plot (sometimes called a boxplot) is a graph of a five number summary. It does not show a distribution in as much detail as a stem and leaf plot or histogram.
However, box and whisker plots are ideal for comparing similar distributions at a glance. The centre, spread and overall range are immediately apparent. They can also help detect symmetrical or skewed distributions.
In a box and whisker plot:
- the ends of the box are the upper and lower quartiles, so the box spans the interquartile range;
- the median is marked by a vertical line inside the box; and
- the whiskers are the two lines outside the box that extend to the highest and lowest observations.
It therefore looks like:
| 1. |  | Another computer salesperson, Y, sells the following numbers of computers in 12 months:
51, 17, 25, 39, 7, 49, 62, 41, 20, 6, 43, 13. |
| a) | Give a five number summary of Y’s sales. |
| b) | Make 2 boxplots, one for X’s sales and one for Y’s. |
| c) | Briefly describe the comparisons. |
Answers.
| | a) | First you must find the median. The data in order are:
6, 7, 13, 17, 20, 25, 39, 41, 43, 49, 51, 62.
Median = ( 12 + 1 ) ÷ 2 = 6.5th value |
| | | = (6th + 7th observations) ÷ 2
= (25 + 39) ÷ 2
= 32 |
| | | There are 6 numbers below the median, namely: 6, 7, 13, 17, 20, 25. |
| | Q1 | = the median of these 6 items
= (6 + 1 ) ÷ 2 = 3.5th value
= (3rd + 4th observations) ÷ 2
= (13+17) ÷ 2
= 15 |
| | | There are 6 numbers above the median, namely: 39, 41, 43, 49, 51, 62. |
| | Q3 | = the median of these 6 items
= (6 + 1 ) ÷ 2 = 3.5th value
= (3rd + 4th observations) ÷ 2
= (43 + 49) ÷ 2
= 46 |
| | Therefore, the five number summary is: |
| | 6, 15, 32, 46, 62 |
| | b) | Box and whisker plots can be drawn either vertically or horizontally. |
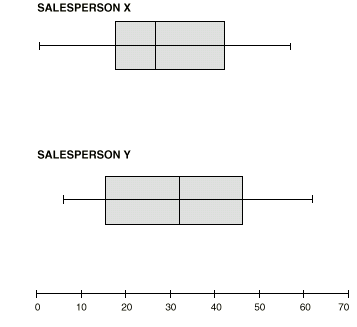
| | c) | Y’s highest and lowest sales are higher than X’s corresponding sales, and Y’s median sales figure is higher than X’s.
This suggests that Y is a consistently higher seller. |
MEAN DEVIATION
Mean deviation is a better measure of spread than range because it compares all data with the mean and then averages the result. Thus:
MEAN DEVIATION = AVERAGE OF SUM OF ABSOLUTE VALUES OF DEVIATIONS FROM MEAN
A step by step approach to finding the mean deviation is:
Calculate the mean.
Subtract the mean from each observation.
Change all the negative values to positive ones.
Add these absolute values.
Divide by the number of observations.
| 1. | In a large school, the numbers of students absent on each day of a particular week were: 40, 30, 45, 50, 35. |
| | Find the: | a) mean
|
| | | b) absolute deviation of each value from the mean
|
| | c) mean deviation |
| | a) |  |
| | | = 200/5
= 40 |
| | b) |
| Number absent (x) | | Absolute deviations |
| |
| |
| | |
| |
| 40 | 40-40 = 0 | 0 |
| |
| |
| 30 | 30-40 = -10 | 10 | | |
| |
| 45 | 45-40 = 5 | 5 |
| |
| |
| 50 | 50-40 = 10 | 10 | | |
| |
| 35 | 35-40 = -5 | 5 |
| |
| | | | | 30 | | |
| | c) | Mean deviation = sum of absolute deviations ÷ no. of observations |
| | | = 30÷5
= 6 |
| | | Thus, the mean deviation is 6. In other words, the difference between the mean and each observation is, on average, 6.
A high mean deviation value indicates a wider spread of data values, while a low value indicates less variability in the data. If all data values are equal to the mean then it follows that the mean deviation is zero.
Mean deviation is easily interpreted and relatively simple to calculate. However, mean deviation and range are rarely used in practice to find the spread of a set of data.
Two other measures are preferred because of their wider mathematical uses in other areas of statistics. These measures are the variance, or more commonly, the square root of the variance: the standard deviation. |
|
|
 Print Page
 Print All