OUTPUT
Between 1985-86 and 2005-06 value added in volume terms grew by 2.0% per year (figure 6.3). Growth has been relatively steady over this period, although it was slightly stronger in the latter half of the 1980s and weaker since the late 1990s.
Figure 6.3 also shows gross output over the period 1994-95 to 2004-05. Gross output shows a similar pattern of growth to value added.
6.3 Electricity, gas & water outputs and inputs, (2004-05 = 100)
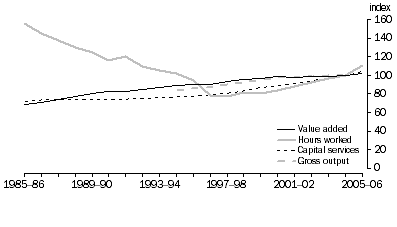
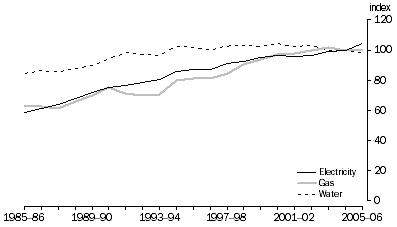
Figure 6.4 shows value added data by subdivision. Electricity industry value added grew on average by 2.7% per year in volume terms between 1985-86 and 2005-06. Over the 1990s Electricity value added growth slowed somewhat, with the slowdown more pronounced from 2000-01. Growth in value added picked up in 2005-06. No output data are available on the specific segments of Electricity industry (generation, transmission or distribution).
Between 1985-86 and 2005-06, Water, sewerage and drainage value added grew by 0.6% per year. However, since 2001-02 value added has fallen. The dry conditions and lower water levels affected output, with lower demand due to water restrictions in most States.
Gas industry value added growth was on average 2.4% per year between 1985-86 and 2005-06. However, over recent years this growth also slowed.
6.4 Electricity, gas & water Value added by subdivision, (2004-05 = 100)
 Print Page
 Print All